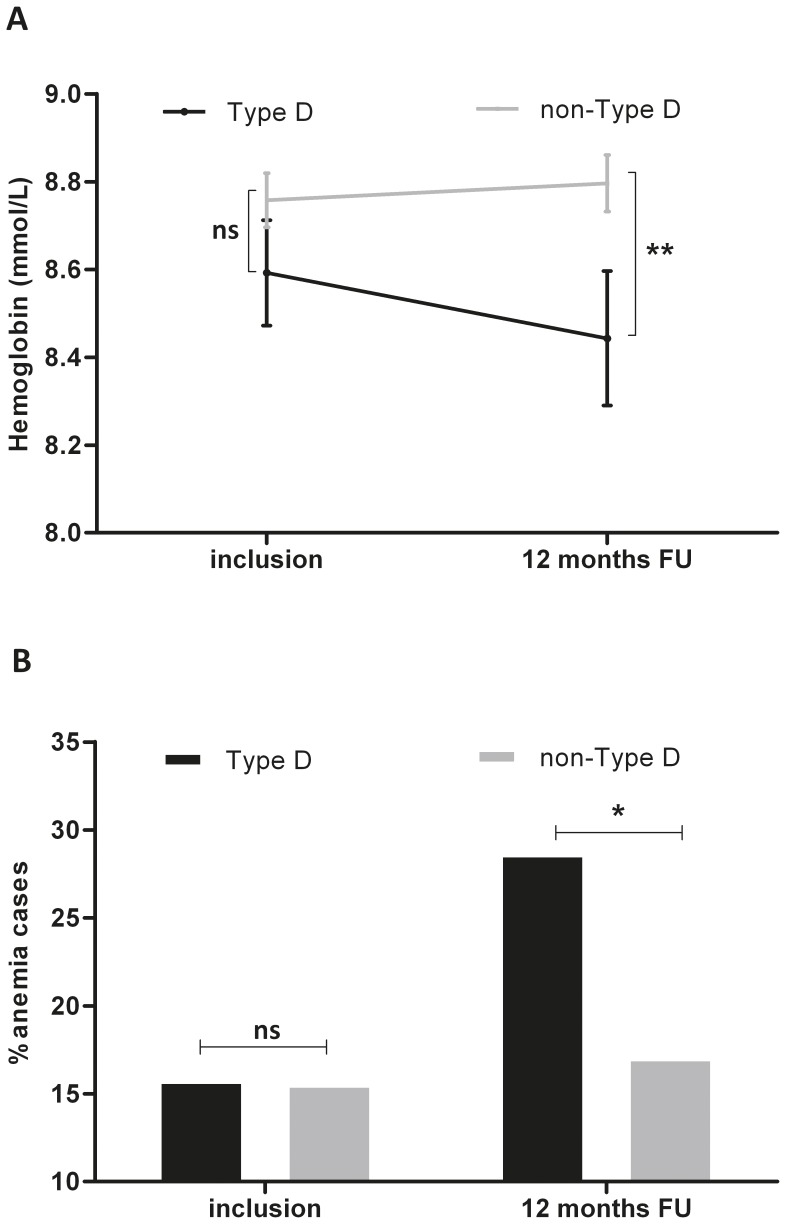
Figure 1. a-b Hemoglobin (1a) and anemia (1b) at inclusion and follow-up by Type D personality.
Levels of hemoglobin and prevalence of anemia at inclusion and follow-up by Type D personality. Figure 1A: Hemoglobin levels at inclusion and 12 months follow-up (FU) stratified by Type D personality; Grey line = non-Type D patients, black line = Type D patients; the error bars represent 1 standard error of the mean. Figure 1B: Percentage of patients with an anemia diagnosis according to WHO guidelines ( = anemia cases), stratified by Type D personality; Grey bars = non-Type D patients, black bar = Type D patients. ** = p<.05 * = p<.10, ns = non-significant.

