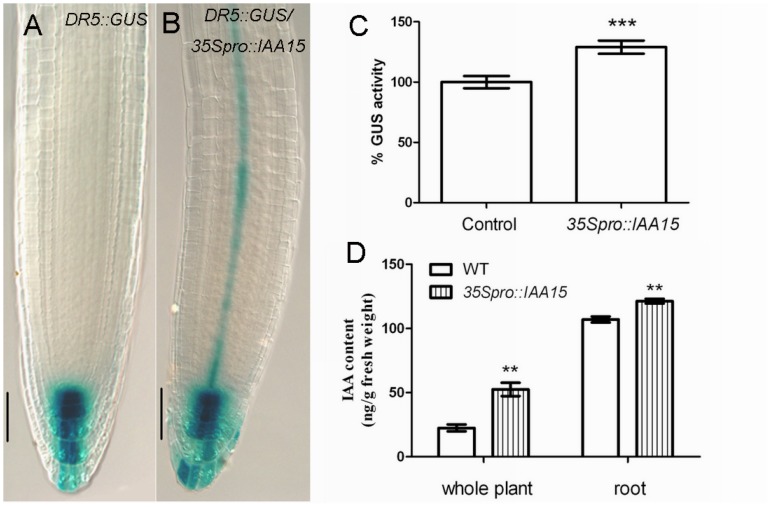
Figure 7. DR5::GUS expression and auxin content in 35Spro::IAA15 transgenic lines.
GUS staining of primary roots for 1.5 hours in five-day-old control (A) and 35Spro::IAA15 (B). (C) Quantification of DR5::GUS activity. Relative GUS activity was calculated by normalizing to the amount of total protein measured by Bradford assay. (D) Free IAA levels (ng/g fresh weight) in seven-day-old wild-type and 35Spro::IAA15. Data is presented as mean ± SD from three independent assays. **P<0.01, ***P<0.001. Bars: 50 µm.

