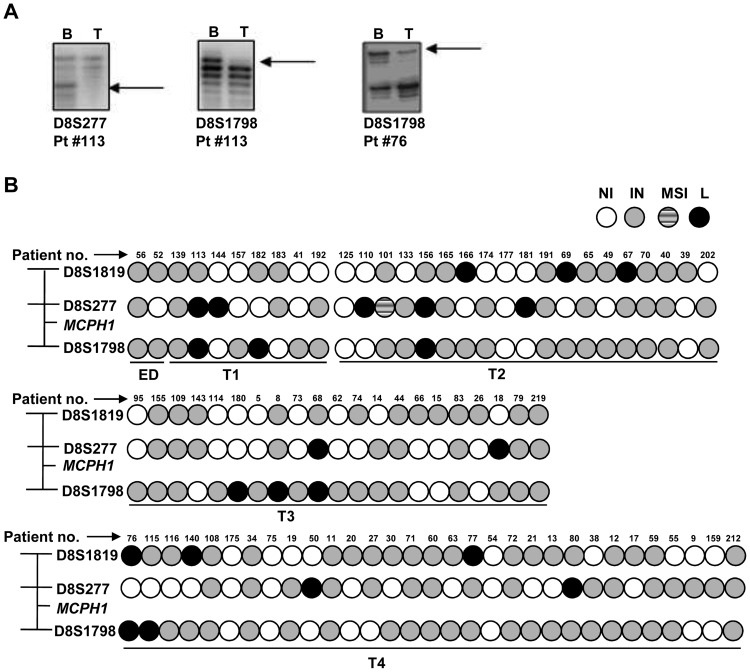
Figure 1. LOH at the MCPH1 locus.
(A) Representative phosphor images showing LOH for the markers D8S1819, D8S277 and D8S1798 flanking the MCPH1 locus. B & T denote constitutive blood/normal oral tissue and tumor DNA respectively. Arrows indicate the loss of alleles in tumor DNA. (B) Diagrammatic representation of LOH data from 81 matched blood/normal oral tissue and tumor DNA samples using three microsatellite markers. Tumor samples are arranged according to their T classification (T1 to T4) or ED (epithelial dysplasia). Abbreviations: NI, non-informative; IN, informative; MSI, microsatellite instability; and, L, LOH.

