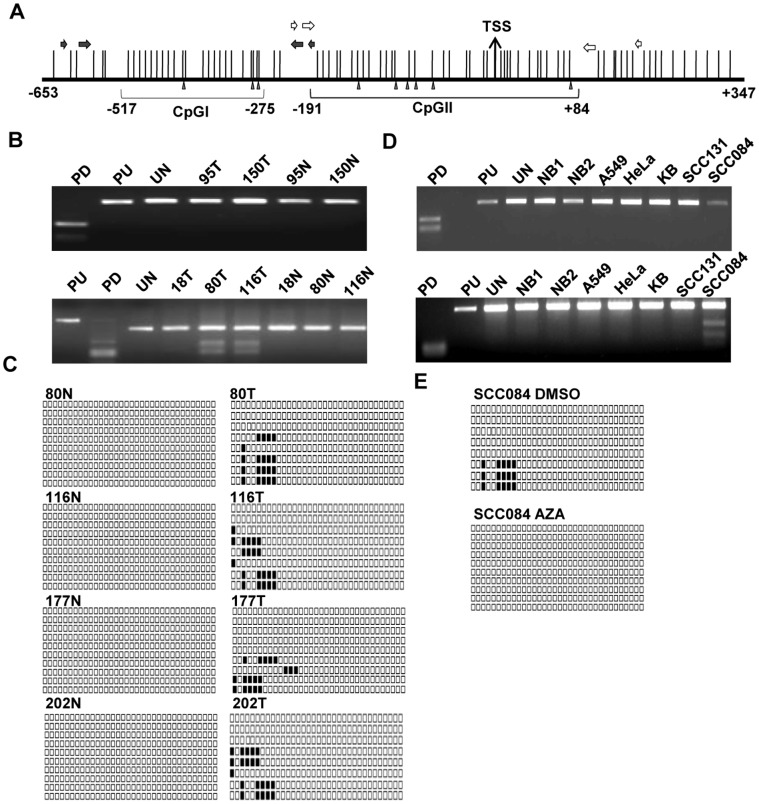
Figure 3. Methylation of CpG islands in the MCPH1 promoter.
(A) Schematic representation of the MCPH1 promoter with two CpG islands. The vertical lines represent the CpG sites. The solid and open horizontal arrows represent primers to amplify CpGI and CpGII islands respectively. Sites for Bst UI and Aci I in CpGI and CpGII, respectively, are marked by filled vertical arrowheads. The numbers represent nucleotide positions with respect to the TSS. (B) Representative agarose gel images of COBRA for CpGI (upper panel) and CpGII (lower panel). Note the absence of methylation of CpGI in tumor samples 95T and 150T, and the methylation of CpGII in tumor samples 80T and 116T. (C) Schematic representation of bisulfite treated genomic DNA sequence of CpGII in normal and tumor tissues from patient numbers 80, 116, 177 and 202. Each row represents a sequenced TA clone. The filled and unfilled squares represent methylated and unmethylated CpGs respectively. Note the methylation of tumor samples and non-methylation of their corresponding normal oral tissues. (D) Representative agarose gel images of COBRA data for CpGI (upper panel) and CpGII (lower panel) in cell lines. None of the cell lines show CpGI methylation, whereas CpGII shows methylation in SCC084 cells only. (E) Bisulfite sequencing of CpGII in SCC084 cells before and after the AZA (2′-deoxy-5-azacytidines) treatment. The CpG sites in CpGII show methylation in DMSO (vehicle control) treated DNA, whereas, as expected, methylation is lost after AZA treatment. Abbreviations: N, normal; T, tumor; PD, positive control (ASPM fragment); PU, positive control undigested; UN, undigested CpG island I or II; and, NB1 or NB2, peripheral blood DNA from unrelated normal individuals. Numbers represent patient numbers.

