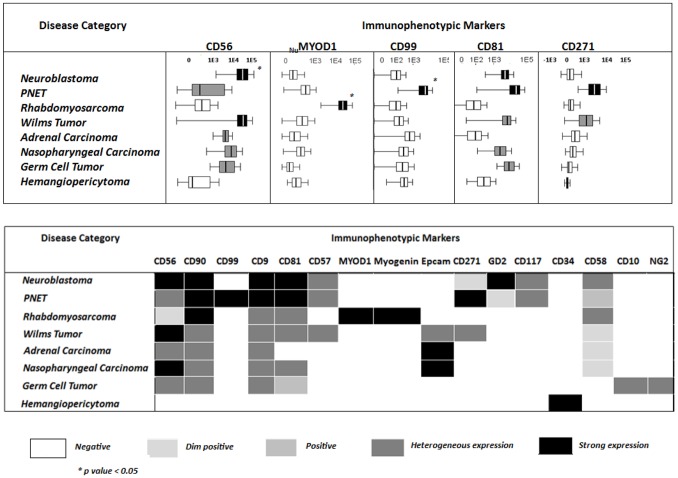
Figure 2. Pattern of expression of individual immunophenotypic markers in distinct diagnostic categories of pediatric solid tumors.
Panel A: Heat map summarizing the intensity and pattern of expression of different markers in distinct diagnostic subtypes of pediatric solid tumors based on mean fluorescent intensity per/cell level. Panel B: Comparison of the mean fluorescent intensity expression of individual markers per/cell in different WHO subtypes of pediatric solid tumors. Boxes extend from the 25th to 75th percentiles, the lines in the middle represent median values while horizontal lines correspond to 95% confidence intervals.

