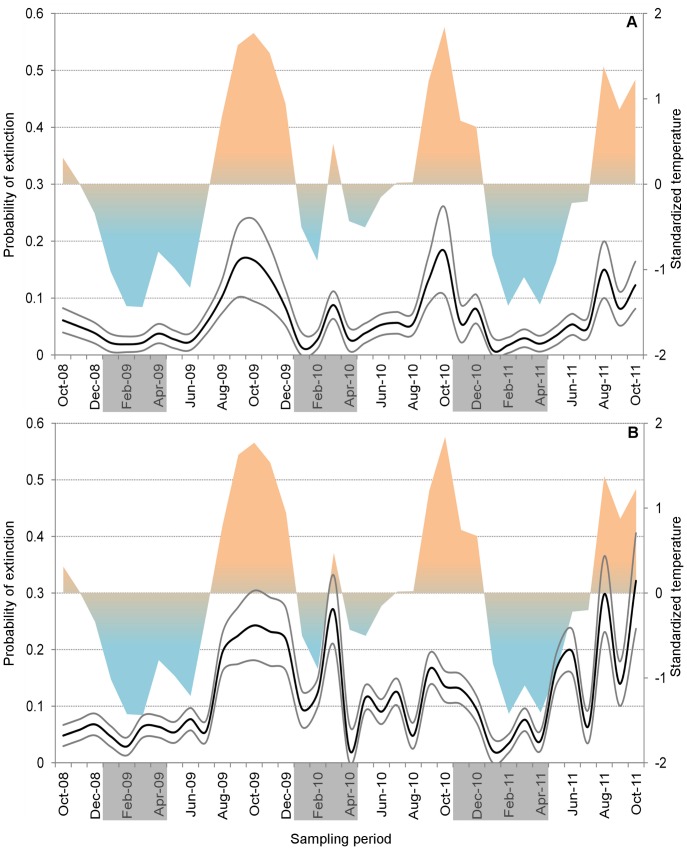
Figure 5. Derived estimates of local extinction probabilities (ε) for Aedes aegypti (A) and Ae. albopictus (B).
For each species, ε estimates (bold black lines) and 95% confidence intervals (thin grey lines) were derived from the best-performing (lowest AICc) 38-month model. We also plot variation (z-scores) of average maximum temperatures during sampling days and the previous two weeks (tmax-2-week-lag, right y axes in each panel; colored areas); this was the meteorological covariate in the best Aedes aegypti model. On the x axis, grey boxes highlight the periods in which city-wide, massive Aedes control campaigns, called Operação Impacto [29], [30], took place; note that they coincide with months of very low ε values.

