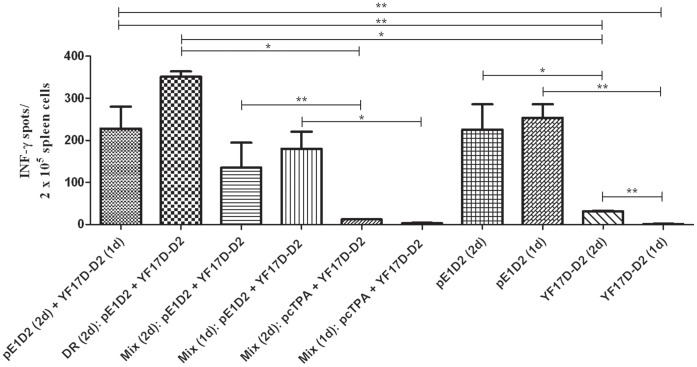
Figure 2. Production of IFN-γ by CD8+ T cells from mice immunized with different vaccination protocols.
Splenocytes collected from the different animal groups (n = 5) were stimulated with a T-cell specific peptide and the number of spot-forming cells (SFC) were quantified in a 24 h ELISPOT assay. Asterisks indicate statistically significant differences using the Mann-Whitney test (*p<0.05; **p<0.01). One dose = 1d; two doses = 2d.

