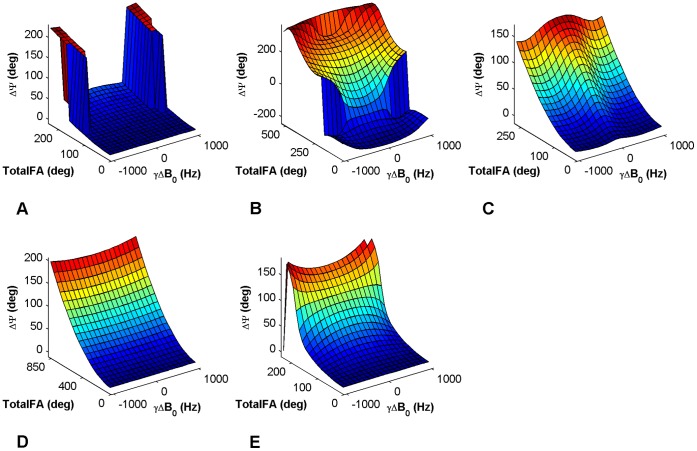
Figure 3. Curves of sensitivity to B1+ and B0 inhomogeneities.
Phase accrual curves of the five methods plotted versus the TotalFA of the RF-pulses and a frequency offset distribution −1 kHz ≤ ΔB0≤1 kHz. The frequency offset range is the same for all methods, while the TotalFA ranges differ, as well as the phase accrual Ψ. These curves were derived from simulations (using the same parameters as in Fig. 1) and used for the 2D interpolation to obtain the B1+ maps. Methods: A – Optimized low-flip-angle method , B – Phase-sensitive method , C – ΦFA-CUP method , D – Bloch-Siegert method, E – Orthogonal-pulses method.

