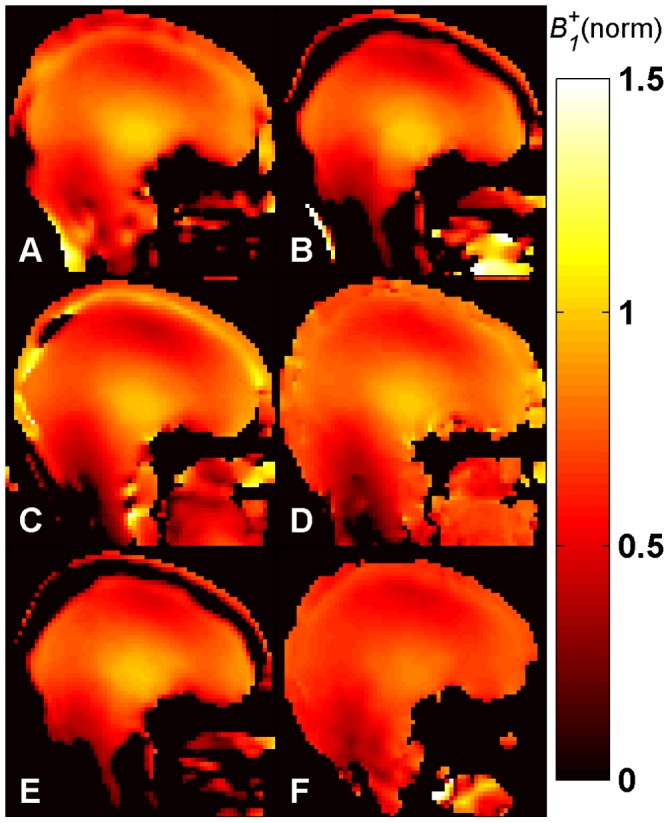
Figure 8. B1+ maps in vivo at 7.0 T.

Central sagittal partition of the 3D B1+ maps of the human brain obtained with methods A-E in vivo at 7.0 T using a birdcage TX/RX coil. Identical repetition times (TR = 110 ms) and SAR levels were used for all methods. The central slice of the B1+ map acquired for comparison with the 2D DAM, with TR = 6000 ms, is also shown (F). All maps are normalized to their nominal B1+ given in Table 1 in µT. Methods: A – Optimized low-flip-angle method , B – Phase-sensitive method , C – ΦFA-CUP method , D – Bloch-Siegert method, E – Orthogonal-pulses method, F – Double Angle method.
