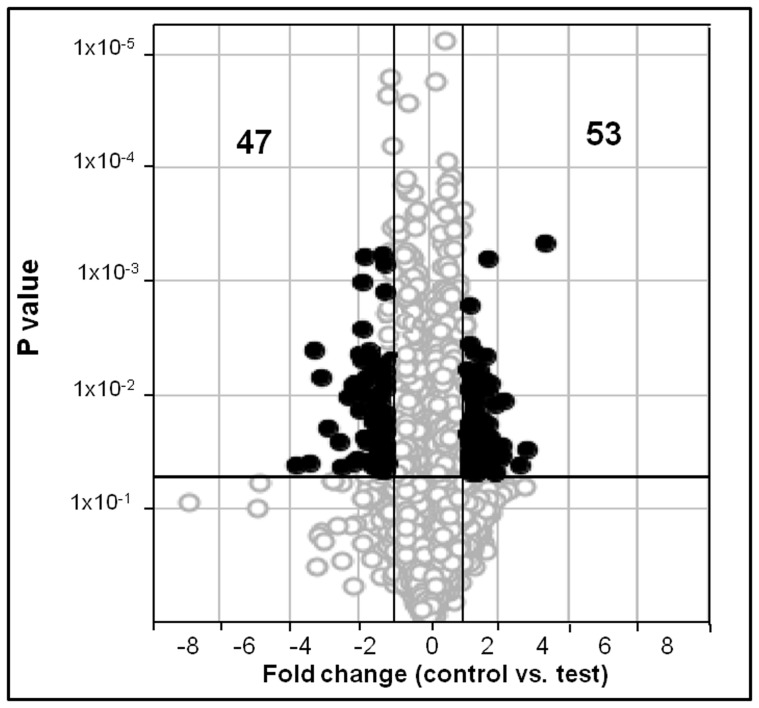
Figure 2. DNA microarray analysis of clinostat-induced gene expression in E. coli.
The Volcano plot depicts gene expression in E. coli culture at 0.8 OD (OD600 nm) cultured in the presence of 10% glycerol under microgravity conditions compared to the control. Genes that are represented on the right side of the volcano-axis are up regulated and those that are on left side of the axis are down regulated. Out of the 4377 genes (O) analysed, 53genes were upregulated (•) and 47were down regulated (•).Only those genes that showed more than 1.5 fold change in expression and a P value <0.05 were identified as either up- or down-regulated. The x-axis represents the fold change and the dark vertical lines represent cut-offs at 1.5 fold decrease and increase. The y-axis represents the p-values and the dark horizontal line indicates a p value cut-off of 0.05.

