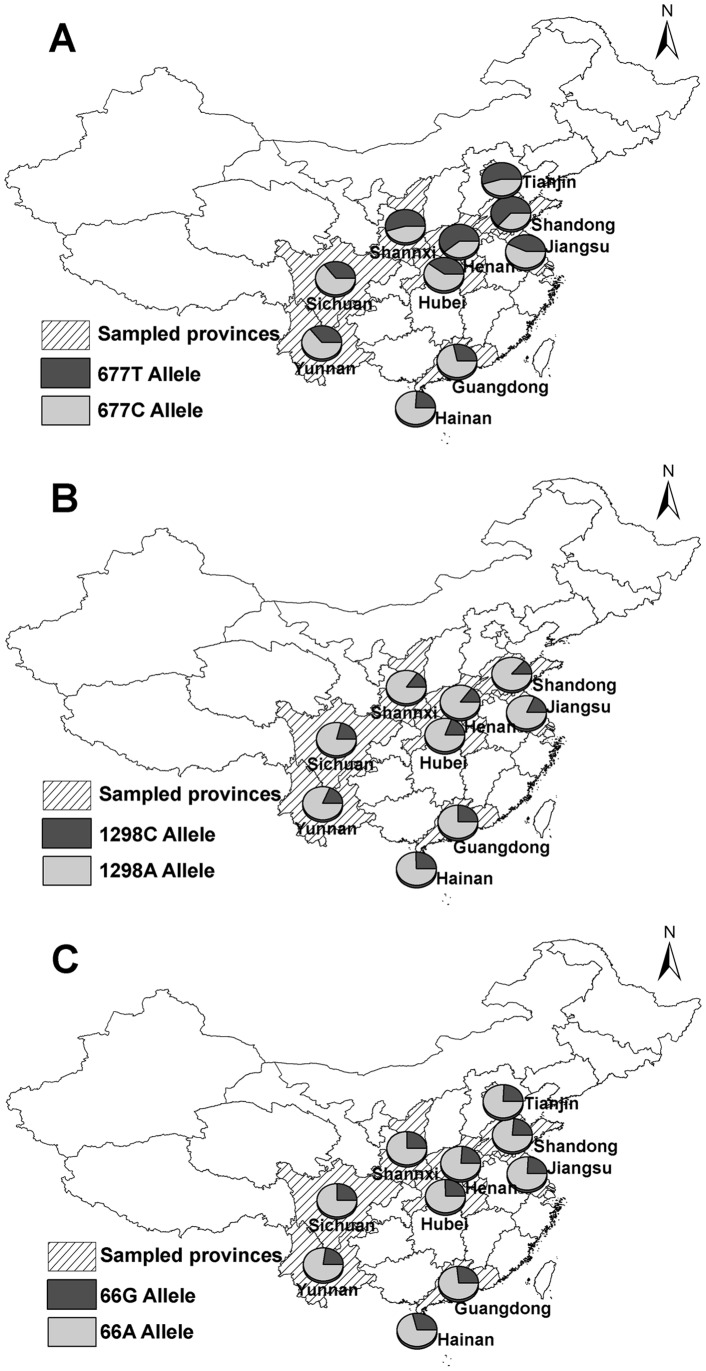
Figure 1. Map of China showing the distributions of the three polymorphisms in different geographical regions.
Figure 1A, 1B, and 1C show the distributions of the MTHFR C677T, A1298C and MTRR A66G polymorphisms, respectively. Circles indicate the locations of the different populations in this study.

