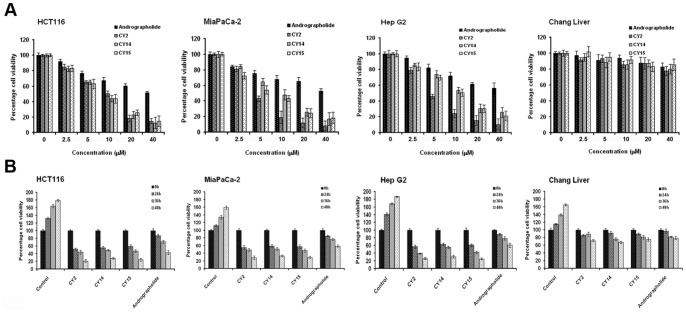
Figure 2. Viability of three cancer lines HCT116, MiaPaCa-2, HepG2 and a non–cancer cell line Chang liver cells was observed in response to andrographolide and its derivatives.
Experimental cells (2×10⁵) were treated with andrographolide and its derivatives. MTT assay was performed. O. D. at 595 nm reflects the viability of cells. (A) Concentration dependent cell viability of potent derivatives from proline series viz. CY2, CY14, CY15 and andrographolide. (B) Time dependent cell viability of potent derivatives from proline series viz. CY2, CY14, CY15 and andrographolide. Percent viability of cells calculated from MTT assay after treatment with 20 µM of each of the potent derivatives and andrographolide for indicated time points. Values are mean ± S.D. and represent one of the 3 representative experiments (P<0.001).

