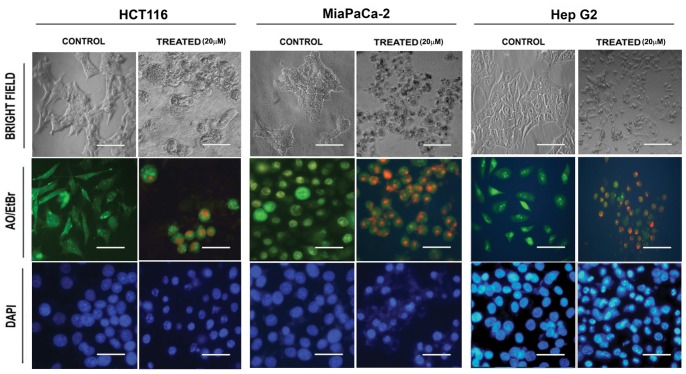
Figure 3. Morphological and nuclear changes seen in HCT116, MiaPaCa2 and HepG2 cells after treatment with CY2.
Cells, treated with 20 µM of CY2 for 36 h were seen under light microscope and/or under fluorescence microscope following nuclear staining with DAPI or acridine orange/ethidium bromide (AO/EtBr). Results in the upper panel shows bright field, middle panel shows acridine orange/ethidium bromide (AO/EtBr) and lower panel shows DAPI stained nuclei of HCT116, MiaPaCa-2 and HepG2 cells respectively. Scale Bar = 15 µm.

