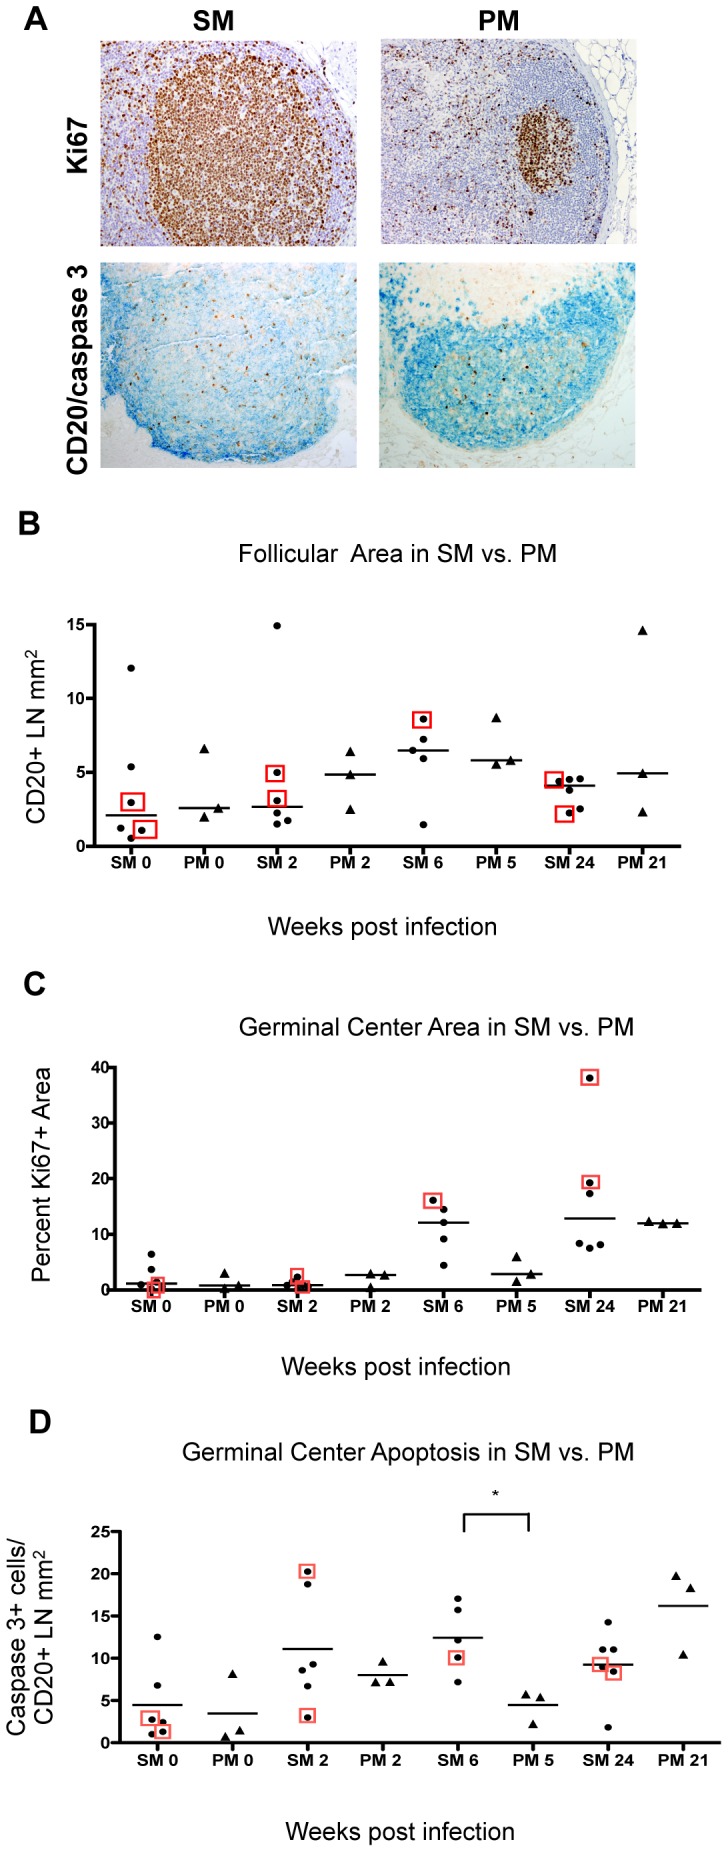
Figure 1. Follicular development and apoptosis within GC.

A, (Top) IHC for Ki67 expression in activated lymphocytes within GC of SM (wk 6) and PM (wk 5). Positive cells indicated by brown 3,3′ diaminobenzadine (DAB) chromogenic substrate; Mayer’s hematoxylin counterstain. (Bottom), Dual IHC for CD20+ B lymphocytes to delineate follicles (labeled with Vector Blue chromogenic substrate), and cleaved-caspase 3 to identify cells undergoing programmed cell death (labeled with brown DAB chromogenic substrate). Counterstain was omitted. All photos taken at original magnification 200x. B, Follicular development is reported as total CD20+ area in mm2 per biopsy. C, Percent germinal center area was quantified as the Ki67+ region that included the zones of centroblasts (i.e., dark zones) and activated centrocytes (i.e., light zones) within follicles, divided by the total LN section area. D, Apoptosis was measured by number of cells positive for cleaved-caspase 3 (caspase 3+) by IHC in B cell areas (CD20+). Both SM and PM had progressive germinal center reactions shown by the trend of increasing germinal center size with increasing apoptosis within germinal centers. SM have more apoptotic cells in GC at 6 wpi compared to PM at 5 wpi (p = 0.035). The number of caspase 3+ cells decrease in SM by 24 wpi, while the number of apoptotic cells in PM continues to increase (trend). CD8 depleted animals were included in the statistical analysis and are indicated by boxes. Pairs of time points were analyzed (MWU) for difference between medians (bars).
