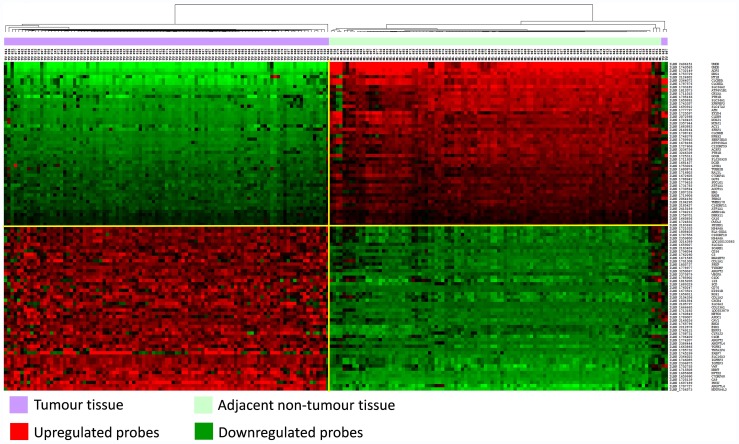
Figure 2. Hierarchical Classification of 100 significant differentially expressed genes in K2 series.
Heatmap representing the 50 significant upregulated (in red) and 50 downregulated (in green) probes with the highest fold change following differential expression in ccRCC compared with non-tumour tissue (FDR-adjusted p-value (BH) <0.05, FC ≥2).

