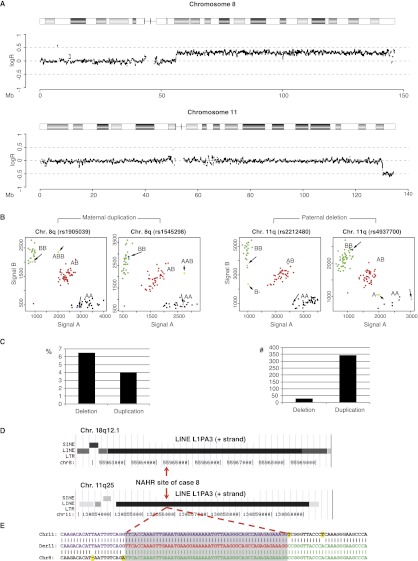
Figure 1.
Determination of the origin and breakpoint sequence of the translocation in case 8. (A) SNP array intensity ratio plots. Log2 intensity ratio of test over reference of the affected chromosomes is plotted on the y-axis against the position from pter to qter on the x-axis. (Gray line) The average test over reference ratio per 10 SNP values. (B) SNP cluster plots of individual SNPs in case 8. Green, red, and black dots represent controls with a BB, AB, and AA genotype, respectively. The pink and blue dots represent the genotypes of the mother and father and the longer arrows point to them. The yellow dots indicate the genotype call of the index patient and are indicated by the shorter arrow. The SNP plots of parental homozygous SNPs demonstrate that the duplication (left two panels) is of maternal origin, while the deletion (right panel) is of paternal origin. (C) The graphs indicate the percentage (left) and total number (right) of informative SNPs found in the deleted and duplicated region of case 8. (D) The breakpoint junction of case 8 is located in 6-kb LINE L1PA3 elements of the same orientation (black bars) with 95% DNA sequence identity in the chromosome regions 8q12.1 (top) and 11q25 (bottom). (Red arrows) The location of the breakpoint junction determined by sequence analysis. (E) DNA sequence alignment of the PCR-amplified translocation junction fragment of case 8 (middle sequence). The breakpoint site was narrowed to a 53-bp segment (gray box) with 100% DNA sequence identity between chromosomes 11 (top) and 8 (bottom). (Purple nucleotides) Alignment with the chromosome 11 sequence; (green nucleotides) alignment with the chromosome 8 sequence; (yellow highlighted nucleotides) trans-morphic mismatches.

