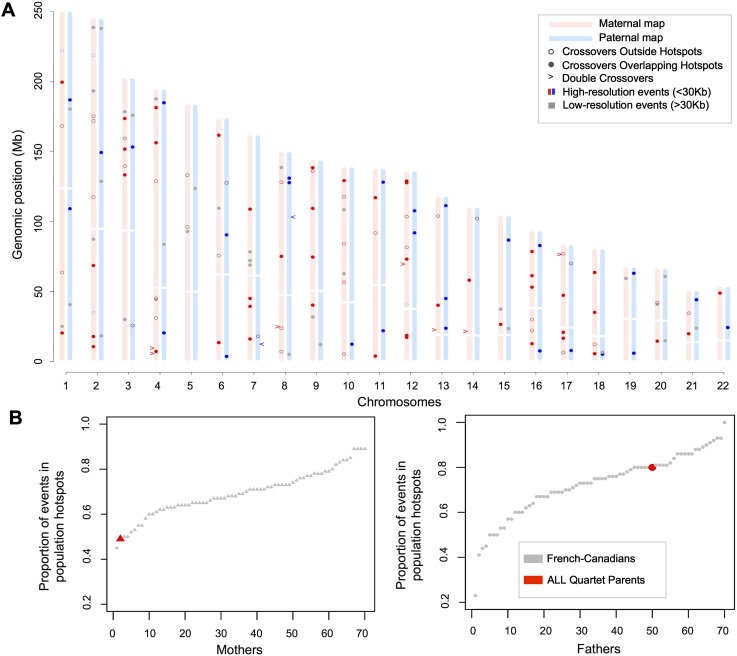
Figure 2.
Map of recombination events and hotspot usage in the ALL quartet. (A) Single and double crossovers in the two meioses that give rise to the patients, determined from analyses of SNPs from exome sequencing and genotyping data. Analyses were performed using pre- and post-treatment samples and only kept crossovers inferred in both. Using two somatic tissues allowed us to remove genotyping errors and double recombination events resulting from errors. All crossovers displayed are supported by at least three informative markers and high-resolution events are localized between informative markers <30 kb apart. (B) Fraction of high-resolution crossover intervals overlapping population hotspots in the FC family cohort and in the ALL quartet. Mothers (triangles) and fathers (circles) are ordered according to their proportion of overlap. We estimate that 11.78% (10.56–13.24 CI 95%) of these crossover intervals are expected to overlap population hotpots by chance.

