Figure 2.
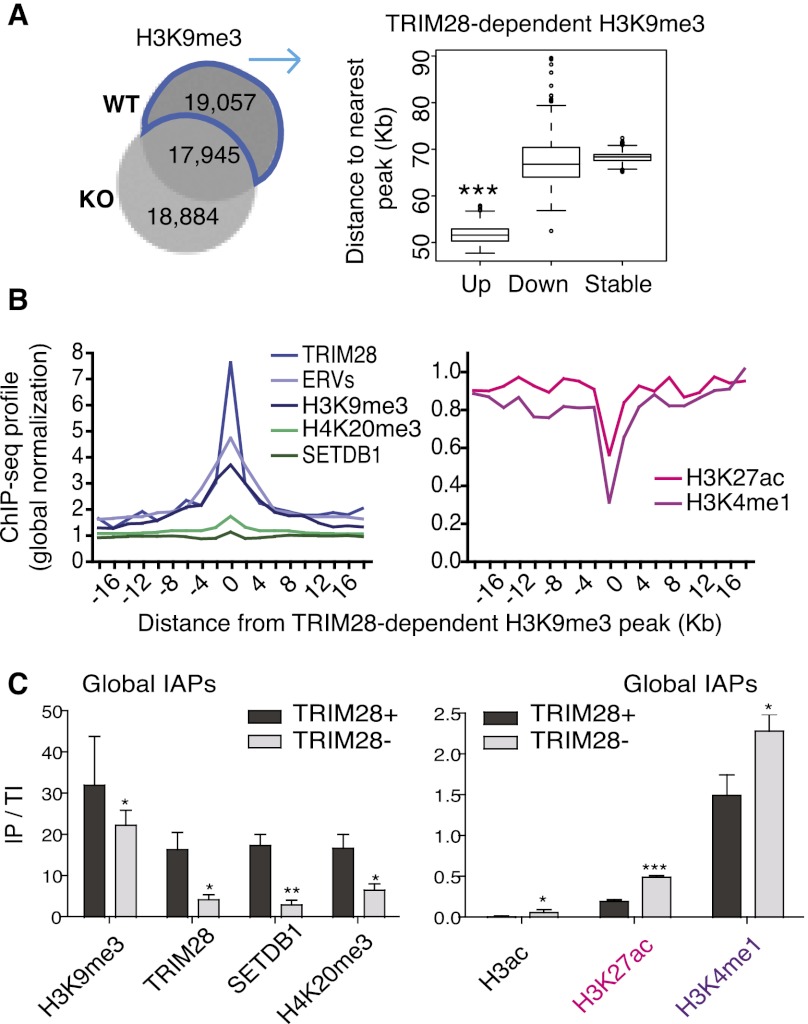
Trim28 deletion triggers a switch from repressive to active chromatin marks at ERVs. (A) Venn diagram of H3K9me3 ChIP-seq peaks in WT versus KO ES cells (left). 19,057 peaks are present in WT but lost in KO cells and so are defined as TRIM28-dependent peaks, which cluster closer to Up genes than Down (P = 0.001418) and Stable (P ≤ 2.2 × 10⁻¹⁶) genes (right). (B) TRIM28-dependent H3K9me3 peaks (see above) were assessed for correlation with ChIP-seq data sets. Positive correlations are shown on the left graph and anti-correlations on the right. All data displayed after global normalization of ChIP-seq counts. (C) ChIP results for repressive (left panel) and active (right panel) marks present at global IAPs (using IAP 5′-UTR primers). Bars show the mean and SD of three to four ChIPs per antibody with immunoprecipitate values normalized to total inputs (IP/TI) relative to Gapdh. Negative controls of no antibody were used in all experiments giving no enrichments, while the Pou5f1 enhancer served as a positive control with high enrichments for both H3K27ac and H3K4me1 of 1.1 and 7.5, respectively. Results were also reproduced in an independent ES cell line (Rex1). Paired t-tests were used to compare WT and TRIM28-depleted samples for each antibody: H3K9me3, P = 0.014; TRIM28, P = 0.027; SETDB1, P = 0.0036; H4K20me3, P = 0.0308; H3ac, P = 0.0337; H3K27ac, P ≤ 0.0001; H3K4me1, P = 0.011.

