
Figure 2.
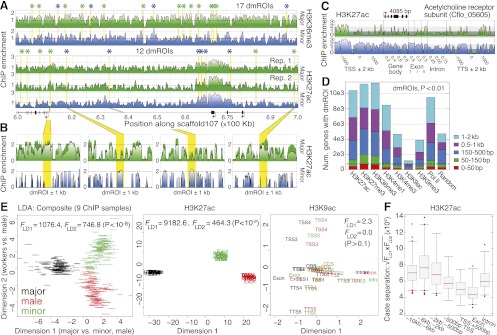
Histone PTMs discriminate ant castes. (A) High-resolution profiles for H3K36me3 and H3K27ac spanning 600–700 kb on scaffold107. Asterisks denote significant differentially marked regions of interest (dmROIs) between majors and minors (P < 0.01) and are colored by enriched caste (major, green; minor, blue). (B) Example dmROIs for H3K27ac (yellow) with 1-kb flanking sequence. Error bars denote SE over two biological replicates. (C) Comparison of major (top) and minor (bottom) ChIP enrichment profiles for H3K27ac over a single gene locus (Cflo_05605), including 2-kb flanking intergenic sequence. (TSS) Transcription start site; (Exon) first (1), internal (i), and last (n) exons; (TTS) transcription termination site; (kb) kilobase. (D) Numbers of genes with TSS-proximal dmROIs (50 bp–2 kb). The expected number of genes for each distance cutoff is shown on right, using randomly sampled coordinates (average of 100 replicates shown). (Dashed line) Expected cutoff for dmROIs within 150 bp of a gene TSS. (E) Two-dimensional linear discriminant (LD) analysis of caste, using ChIP enrichment for 9944 protein-coding genes (13 genic regions, nine ChIP samples per gene). Similar analyses for H3K27ac and H3K9ac also shown on right; Supplemental Figure 10D shows a similar plot for H3K27me3. Data points are labeled by genic region and/or ChIP sample and are colored by caste as indicated. (F) Caste separation  was assessed near genes as shown by randomly sampling 10,000 loci and performing LD analysis, as done in E. Each distribution shows n > 30 replicates. (Boxes) 25th–75th percentiles; (whiskers) 5th–95th percentiles; (points) outliers. (bp) Base pairs.