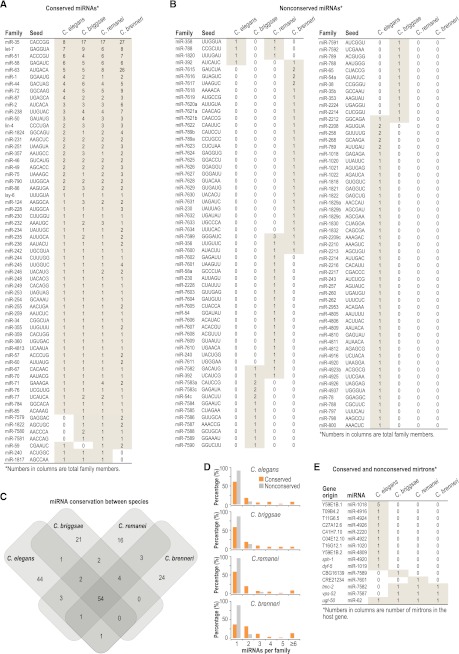
Figure 2.
Conservation of miRNAs in nematodes. (A) Table of conserved miRNAs classified by family. Seed sequences are positions 2–7, relative to the 5′ end of the miRNA. The number in each row represents the number of miRNAs in each family in each species. Shading indicates presence of at least one member of a family. (B) As in A, but nonconserved miRNAs. (C) Venn diagram shows the number of miRNA families and their overlap in each of the four nematode species. (D) The percentage of families having the indicated number of members is shown for conserved and nonconserved miRNAs in each species. (E) Table of mirtrons classified by the gene hosting the mirtron.

