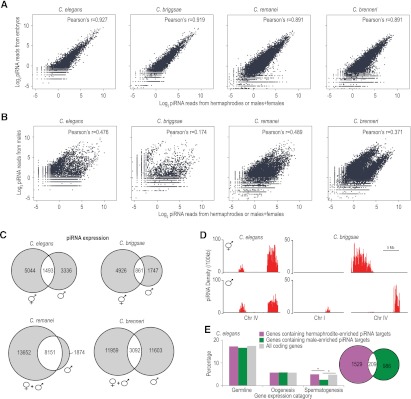
Figure 4.

Two distinct classes of piRNAs in each species. (A) Scatter plots display the levels of piRNAs in adult hermaphrodites or adult females+males (x-axis) and early embryos (y-axis). (B) Scatter plots display the levels of piRNAs in adult hermaphrodites or adult females+males (x-axis) and adult males (y-axis). (C) Venn diagrams show the number of piRNAs that are greater than threefold enriched in hermaphrodites/females+males (left) or males (right). piRNAs shown in the overlapping section have similar expression levels in hermaphrodites/females and males. (D) Distribution of hermaphrodite- or male-enriched piRNA loci per 100 kb in C. elegans and C. briggsae. (E) The bar diagram displays the percentage of C. elegans genes containing hermaphrodite- or male-enriched piRNA target sites that are expressed in the germline, during oogenesis or during spermatogenesis. Asterisks indicate that the difference is statistically significant (P < 0.001, χ2 test). The Venn diagram shows the numbers of C. elegans genes containing target sites for hermaphrodite- or male-enriched piRNAs in purple and green, respectively.
