Figure 5.
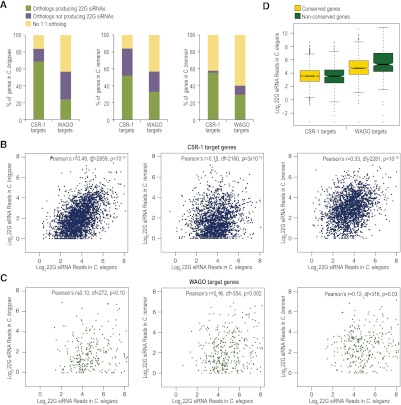
Conservation of CSR-1 and WAGO class 22G siRNA pathways. (A) The percentages of C. elegans CSR-1 or WAGO target genes that contain an ortholog in C. briggsae, C. remanei, or C. brenneri, as well as the percentage of orthologous genes that produce 22G siRNAs in each species, is shown. (B) Scatter plots display conserved CSR-1 target genes having at least one siRNA read as a function of the log2 22G siRNA reads in C. elegans versus each of the other species. Pearson's r values and corresponding P-values for significant correlation are shown. Degree of freedom (df) = number of orthologs analyzed − 2 was used for P-value calculation. (C) Same as B, but conserved WAGO target genes are plotted. (D) Box plot displays the levels of 22G siRNAs generated from conserved and nonconserved CSR-1 and WAGO target genes in C. elegans.

