
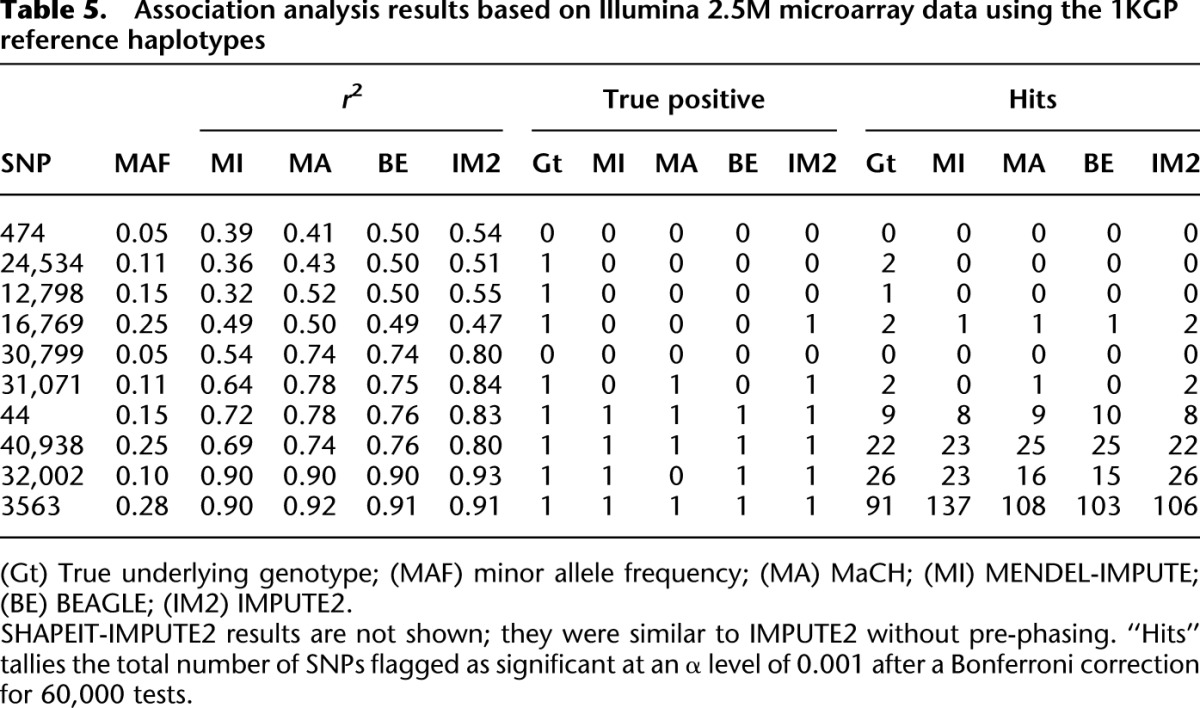
Table 5.
Association analysis results based on Illumina 2.5M microarray data using the 1KGP reference haplotypes
Official websites use .gov
A
.gov website belongs to an official
government organization in the United States.
Secure .gov websites use HTTPS
A lock (
) or https:// means you've safely
connected to the .gov website. Share sensitive
information only on official, secure websites.
Association analysis results based on Illumina 2.5M microarray data using the 1KGP reference haplotypes