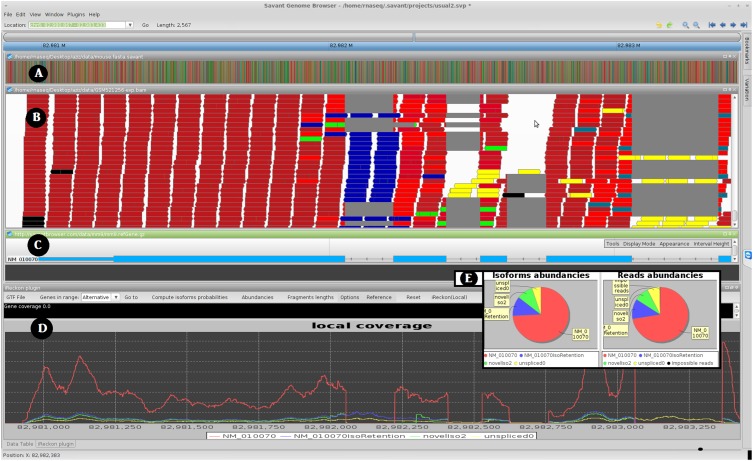
Figure 1.
Screen shot of Savant transcriptome analysis plug-in (RNA-seq Analyzer). (A) Track for the reference genome. (B) Track visualizing aligned reads, with the color representing their isoform of origin probabilities. (C) Known isoform annotation from UCSC. (D) The estimated coverage signal for the various isoforms detected by iReckon. If two RNA-seq data sets are loaded, one can also view differences between abundances of each isoform in the two data sets. Note that the blue isoform has an intron retention event (middle). Because this isoform corresponds to a non-negligible fraction of the overall gene expression level, the failure to identify this event may lead to inaccuracy in quantifying the other isoforms. Additionally, iReckon identifies and quantifies the canonical isoform (in red), the pre-mRNA (in yellow,) and an additional isoform with an alternative donor site (in green). (E) An alternative view of the relative isoform abundances and proportions of reads assigned to each isoform are provided via pie charts. In B and E, black reads are those that could not be assigned to any detected isoforms.

