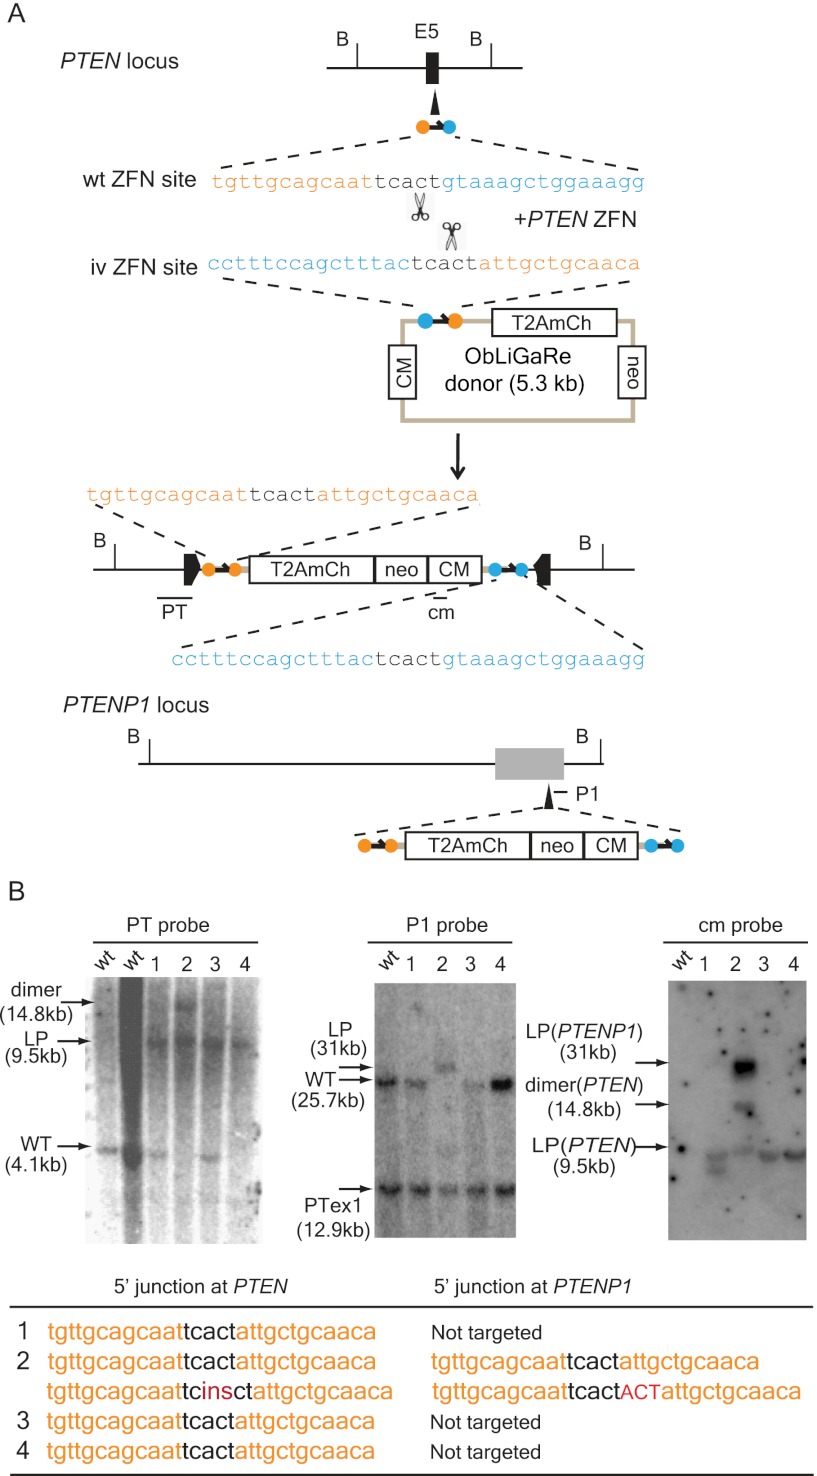
Figure 2.
ObLiGaRe at the PTEN locus. (A) Strategy for targeting human PTEN and PTENP1. PTEN ZFN recognition sites are indicated as orange and cyan circles with the corresponding sequences displayed in the same color scheme. The predicted joining sequences between the vector and the genome are indicated. The insertion of the vector will cause a size shift of a BsrGI (B) digested fragment from wild type of 4.1 kb (WT) to the ligation product of 9.5 kb (LP) at PTEN locus and 25.7 kb (WT) to 31.0 kb (LP) at PTENP1 locus. PTEN internal probe (PT), PTENP1 (P1), and vector-specific probe (cm) are indicated in the map at the hybridization sites. (B) Southern blots using probes specific for PTEN (PT, left), PTENP1 (P1, middle), and the vector (cm, right) for four G418-resistant colonies. P1 probe also could detect exon 1 of PTEN, which is the lowest signal across all lanes (middle blot). The sequence of the 5′ junction between PTEN or PTENP1 and mCherry are indicated in the table. Insertions are indicated in red, where “ins” represents a 224-bp insertion.

