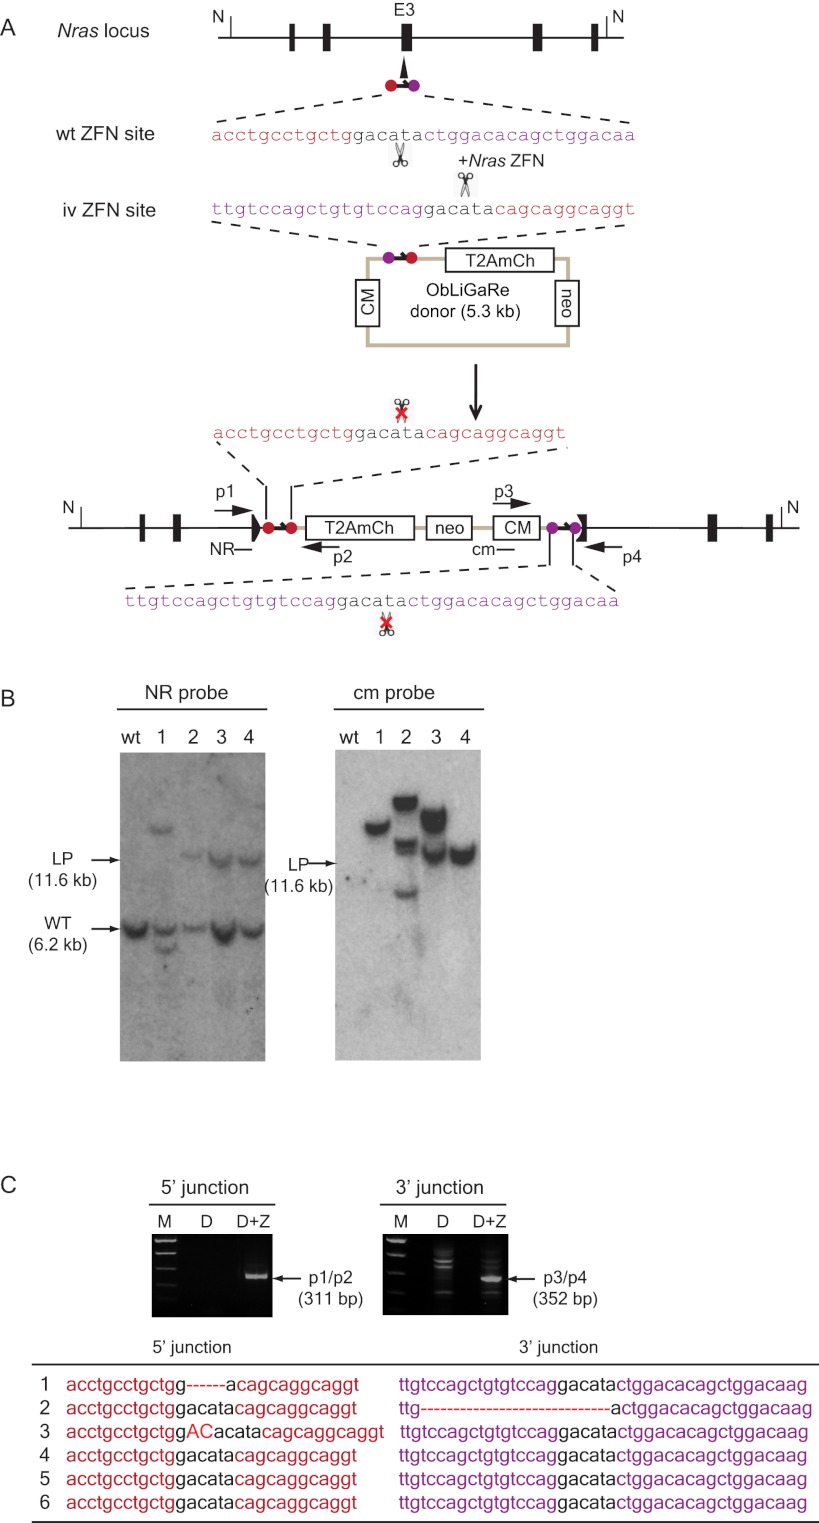
Figure 3.
ObLiGaRe in C2C12 and MEF cells. (A) Strategy for targeting Nras locus in MEF and C2C12 cells. Nras ZFN sites are indicated as violet and red circles with the corresponding sequences displayed in the same color scheme. The predicted joining sequences between the vector and the genome are shown. Primers for PCR detection of the junctions and probes (cm and NR) are indicated. The insertion of the vector will cause a size shift of an NdeI (N) digested fragment from wild type of 6.2 kb (WT) to the ligation product of 11.6 kb (LP) at Nras locus. Nras-specific probe (NR) and vector specific probe (cm) are indicated in the map at the hybridization sites. (B) Southern blot for four C2C12 clones expressing mCherry. (LP) Expected ligation product band upon integration of the vector in the genome. The band lower than the WT band in clone 1 might be a deleted Nras allele since C2C12 cells are tetraploid. (C) Genomic PCR products amplified from pools of MEFs after transfection with ObLiGaRe donor alone (D) or with Nras ZFN plasmid (D+Z). p1-p2 primers amplify the 5′ junction and p3-p4 primers amplify the 3′ junction. The table lists the sequences of individually isolated PCR fragments. Deletions are indicated as red dotted lines; insertions, in red capital letters.

