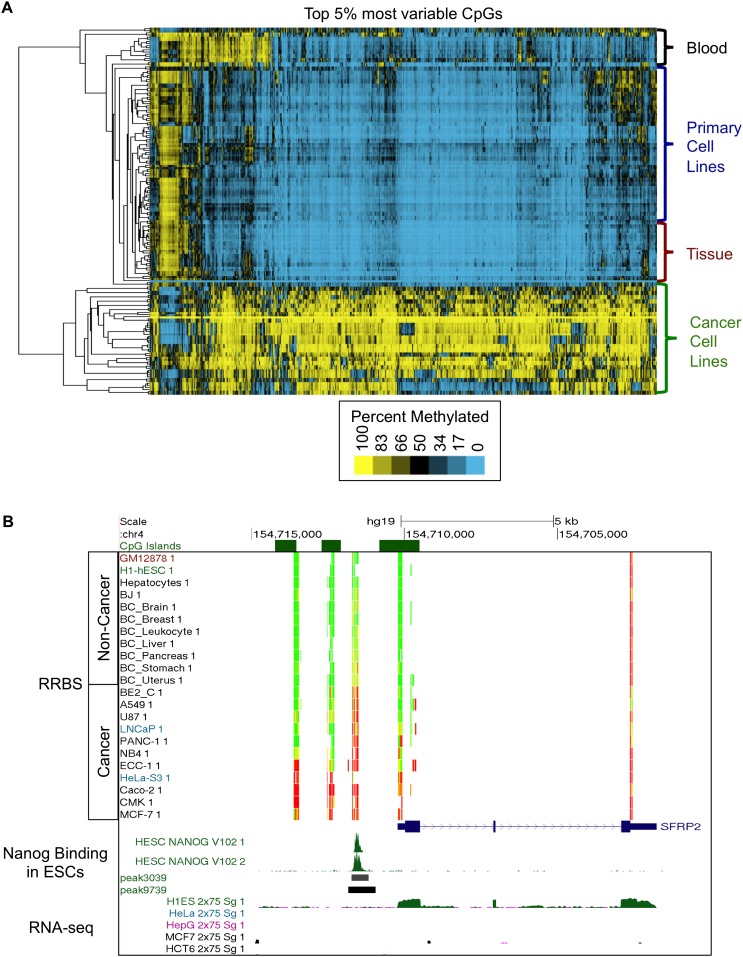
Figure 1.
Methylation patterns distinguish cell types and reveal aberrant hypermethylation across cancers. (A) Unsupervised hierarchical clustering of the top 5% of CpGs with the most varying methylation across 82 samples distinguishes four major clades, identified as cancer cell lines, tissues, primary cell lines, and blood leukocytes. (B) Loci that are hypermethylated across cancers are significantly enriched for sites that are bound by NANOG in embryonic stem cells. UCSC Genome Browser visualization of the SFRP2 gene showing DNA methylation data, NANOG binding sites in the embryonic stem cell line H1-hESC (H1-hESC), and RNA-seq data. The color in the RRBS track indicates the percent of molecules that are methylated at each CpG position. (Red) 100%, (yellow) 50%, (green) 0%. Hypermethylation across the cancers occurs in the SFRP2 gene promoter where NANOG, a transcription factor, binds in H1-hESC. NANOG binding in H1-hESC is visualized as green peaks in both ChIP-seq replicates, and peak boundaries are depicted as black and gray boxes below the raw signal (darker boxes indicate a more significant peak). The RNA-seq data demonstrate that SFRP2 is expressed in H1-hESC and not expressed in the cancer cell lines (HeLa, HepG2, MCF7, and HCT116).

