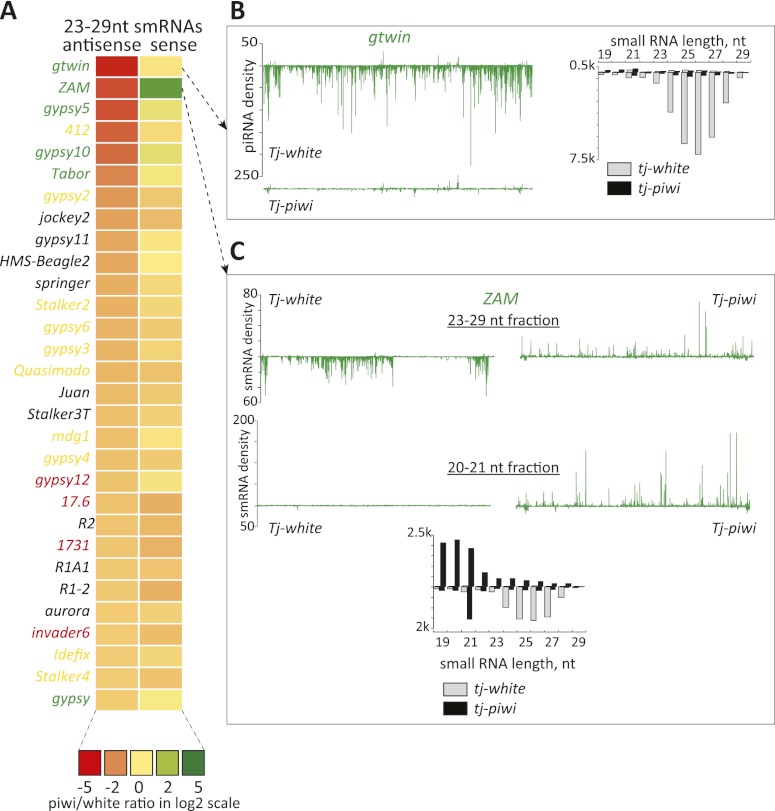
Figure 2.
Effects of somatic piwi knockdown on piRNAs. (A) A heat map represents fold changes (key below) in presumed piRNAs (23–29 nt in length) that are sense or antisense to transposons. Elements are ranked according to the fold change (decrease) in antisense piRNAs. Color coding for names represents the cell type bias of the element, with the colors as defined in Figure 1. (B, top) As an example, a soma-biased transposon, gtwin, is shown. piRNA density in library from the control animals is displayed along a line representing the extent of the transposon consensus. Below is shown piRNA density observed in libraries from the knockdown animals. To the right, small RNAs are shown according to their size distributions, divided into sense (above the axis) and antisense (below the axis) species. Control and piwi knockdown libraries are as indicated. (C) An analysis of the ZAM transposon, similar to what is described in B, is shown. Here, both piRNA (23–29 nt, top) and siRNA (20–21 nt, bottom) fractions are plotted along the transposon consensus.

