Figure 3.
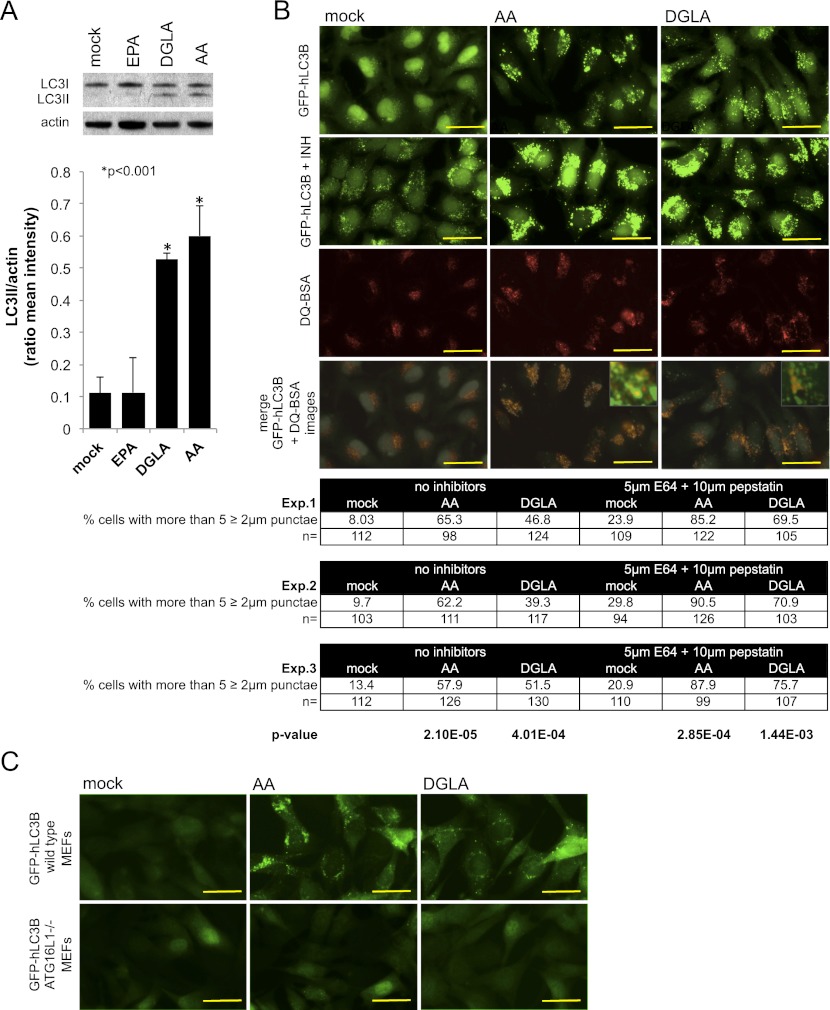
ω-6 PUFAs activate autophagy in mammalian cells. (A) AA and DGLA supplementation leads to an increase in LC3II in HeLa cells. Fifty percent confluent cells were treated with 100 μM AA, DGLA, or EPA or mock-treated with an equal volume of 50% ethanol for 24 h. Representative Western blot analysis of endogenous LC3 in supplemented or mock-treated cells is shown, and quantification of LC3II (autophagy-specific form) signal intensity relative to actin from three independent experiments is depicted as mean ± SEM. (B) AA and DGLA activate autophagy in HeLa cells. The top row depicts HeLa cells stably expressing GFP-hLC3B grown in rich culture medium supplemented with 100 μM AA or DGLA or equal volume of ethanol and imaged after 30 h of total treatment. Quantification of GFP-hLC3B punctae is presented in the table below. The second row shows the increase in GFP-hLC3B punctae observed when the lysosomal inhibitors E64d (5 μg/mL) and pepstatin (10 μg/mL) were added to cells pretreated for 24 h with carrier or fatty acids and incubated for another 6 h with the inhibitors. Quantification of GFP-hLC3B punctae is presented in the table below. The third row shows lysosomal breakdown capacity in the presence of fatty acids as revealed by the cleavage and consequent dequenching of 10 μg/mL red DQ-BSA added after a 24-h treatment with fatty acids and incorporated and cleaved for 6 h. The fourth row shows that the GFP-hLC3B and red DQ-peptide signals overlap in the AA- and DGLA-treated cells (merges between the top and third row images are shown). For all experiments, images were taken after 30 h of total treatment. Images are representative from at least three independent experiments. Bars, 20 μm. The table shows GFP-hLC3B punctae quantification and statistical analyses for three independent experiments. Proportion of cells showing more than five GFP-hLC3B punctae ≥2 μm in the presence or absence of the lysosomal inhibitors is shown as percentages of the total number of cells (n) analyzed per treatment. The number of dots >2 μm per cell was quantified from at least 10 different fields using SPOT software. P-values relative to mock-treated cells are presented at the bottom of the columns. Protein aggregation control is shown in Supplemental Figure S7A, and p62/SQSTM1 degradation control is shown in Supplemental Figure S7B. (C) AA- and DGLA-triggered activation of autophagy in mouse embryonic fibroblasts (MEFs) is ATG16L1-dependent. The top row shows wild-type MEFs stably expressing GFP-hLC3B grown in rich culture medium supplemented with 100 μM AA or DGLA or equal volume of ethanol and imaged after 24 h of total treatment. The bottom row shows ATG16L1−/− MEFs stably expressing GFP-hLC3B grown in rich culture medium supplemented with 100 μM AA or DGLA or equal volume of ethanol and imaged after 24 h of total treatment.

