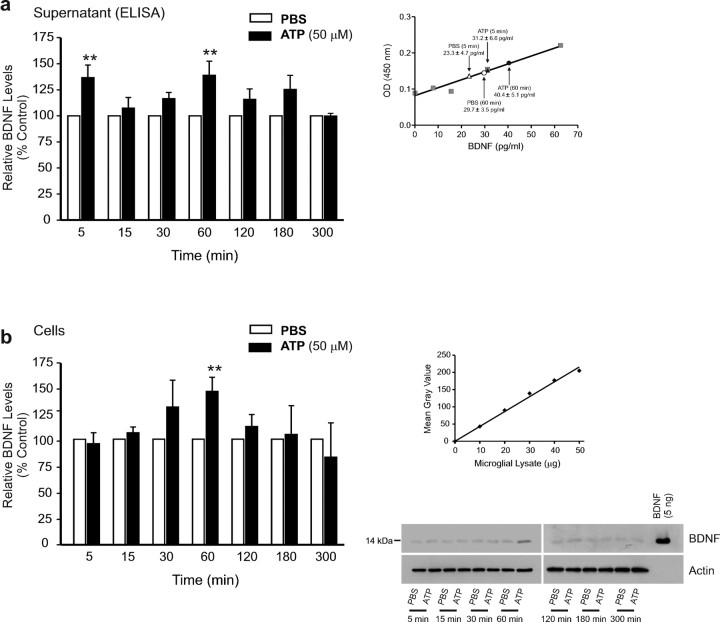
Figure 1.
ATP causes a biphasic release of BDNF and an increase in BDNF protein in rat primary microglial culture. a, Left, ELISA-based measurement of BDNF released into the supernatant at different time points after adding ATP. a, Right, A representative BDNF ELISA standard curve (R2 = 0.97); mean BDNF measurement for PBS and ATP (50 μm) treated groups at 5 min and 60 min is indicated on the graph. b, Left, Western blot analysis of BDNF protein in microglial cell lysates after adding ATP. Band intensity was quantitated as mean gray value and normalized to PBS-treated control. b, Right, Representative standard curve derived from serial dilutions of primary microglial cell lysate proteins (R2 = 0.98). Representative Western blot of BDNF protein from microglial cell lysate. In each lane, 35 μg of protein was loaded. Each time point represents n = 6–8. Data are presented as mean percentage of PBS-treated control (±SEM). **p < 0.01 compared with PBS-treated control.

