
Fig. 2.
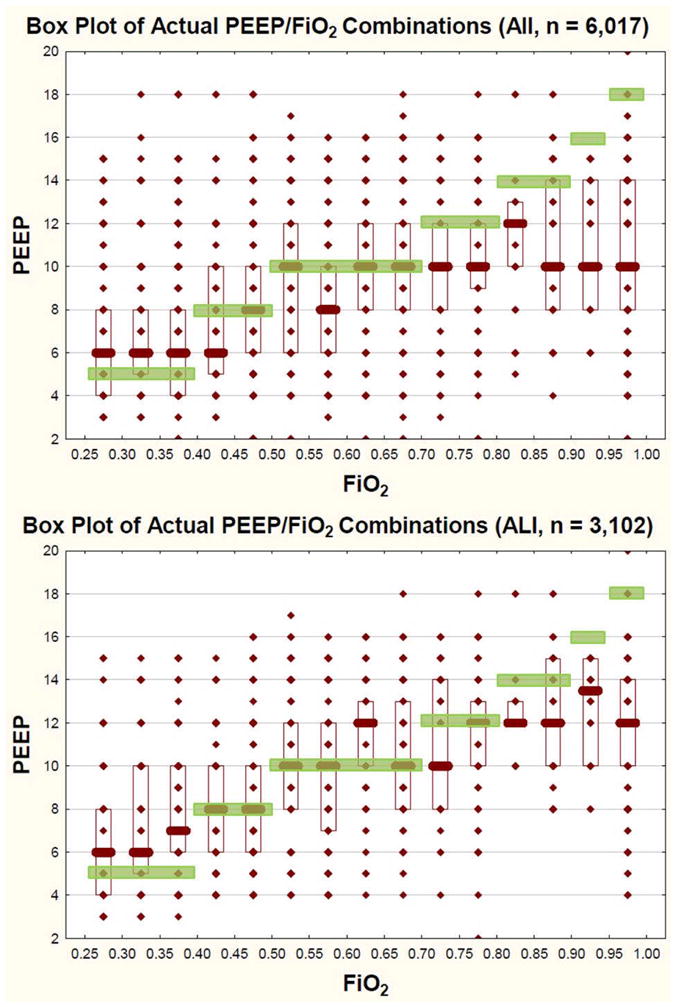
Fig 2 (a, b): PEEP/FiO2 titration tables from clinical care for all patients (a, top) and for patients with bilateral pulmonary infiltrates (ALI Cohort, b, bottom). The y axis represents actual PEEP values as a function of actual FiO2 used (x-axis). The superimposed green boxes represent the pediatric mechanical ventilation protocol target combinations of FiO2/PEEP. For all patients, there is variability in FiO2/PEEP combinations clinicians choose. In general, clinicians use less PEEP than the protocol would recommend, particularly when FiO2 climbs above 0.7. For the ALI cohort (b, bottom), clinicians may be more likely to increase PEEP, although they still use less PEEP than the protocol would recommend, particularly when FiO2 climbs above 0.8. Actual value (diamond), Median (Bar), IQR (Box), Protocol Target (Green Boxes).