
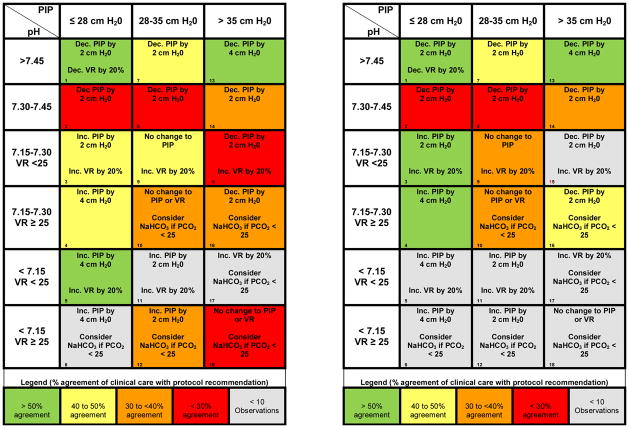
Table 4.
Table 4(a,b) Adapted ventilation table for PC mode, with cell numbers listed in the lower left hand corner of each cell (corresponding to Table 5). For changes in ventilation (PIP or Vent Rate) each ABG/Ventilator setting combination was categorized into the boxes on the above ventilation table. The direction of change to VR and PIP which clinicians chose was compared to the direction of change of the ventilator protocol’s recommendation. Table 4a (left) uses all observations (N=2,719), while Table 4b (right) includes observations from patients with bilateral pulmonary infiltrates (ALI cohort, N=1,415). Colors represent percent agreement with ventilator protocol recommendations: >50% agreement (green), 40–50% (yellow), 30–40% (orange), < 30% (red), excluded cells (<10 observations, grey). Note that changes to PIP and VR are similar between the ALI cohort and the entire cohort, particularly when pH is >7.30.
|