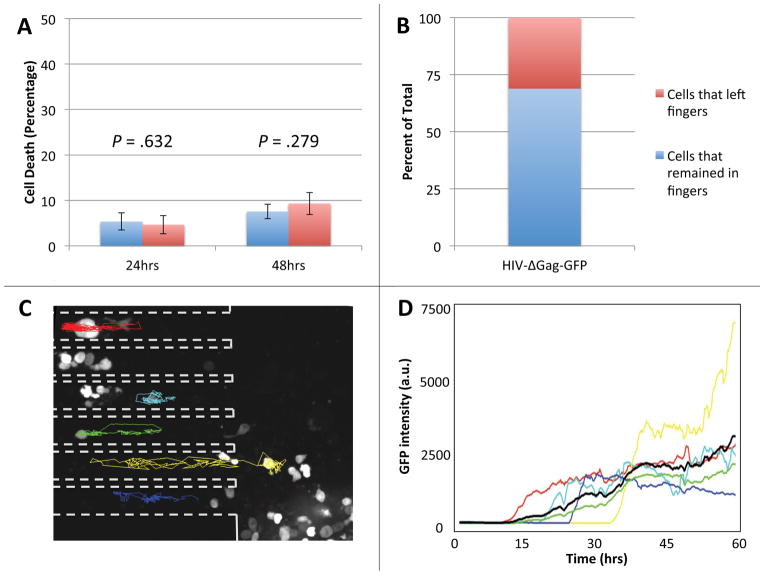
Figure 2. Primary human CD4+ T lymphocytes in the microfabricated device maintain viability and can be reliably tracked.
(A) Cells placed within the finger-like channels of the device or in standard culture dishes were stained with Yo-Pro®-1 Iodide cell death stain after 24 and 48 hours. In the device, 4.66 ± 2.01% of cells stained positive after 24 hours, a statistically insignificant difference from the 5.36 ± 1.91% positively stained cells in culture (p = .632). After 48 hours, there was also no statistically significant difference in the number of dead cells in the device, 9.32 ± 2.45, or in bulk culture, 7.55 ± 1.60 (p = .279). Both p-values were calculated using the Student’s two-tailed t-test. (B) The percent of infected cells that remained within the finger-like channels of the device (69%, blue portion) compared to the number of infected cells that migrated out of the finger-like channels (31%, red portion) over the duration of a 60-hour experiment. (C) Fluorescence micrograph of activated primary human CD4+ T lymphocytes infected with a GFP-expressing HIV-1 virus at 26 hours post infection. Dashed outlines mark the sidewalls of the finger-like channels and colored tracks represent migration trajectories of individual cells over the course of a 60-hour imaging experiment. Random migration of cells in the finger-like channels is largely one-dimensional, making it possible to reliably track cells over the entire 60 hours of the time-lapse experiment. Cells at the bottom of the microwell (large area to the right of the dashed outlines) move about freely in two dimensions and are difficult to track. (D) The intensity of fluorescence of GFP in a cell vs. time for the six infected cells tracked in panel B. The average fluorescence signal (black line) shows that cells start expressing GFP at approximately 10 hours after infection.

