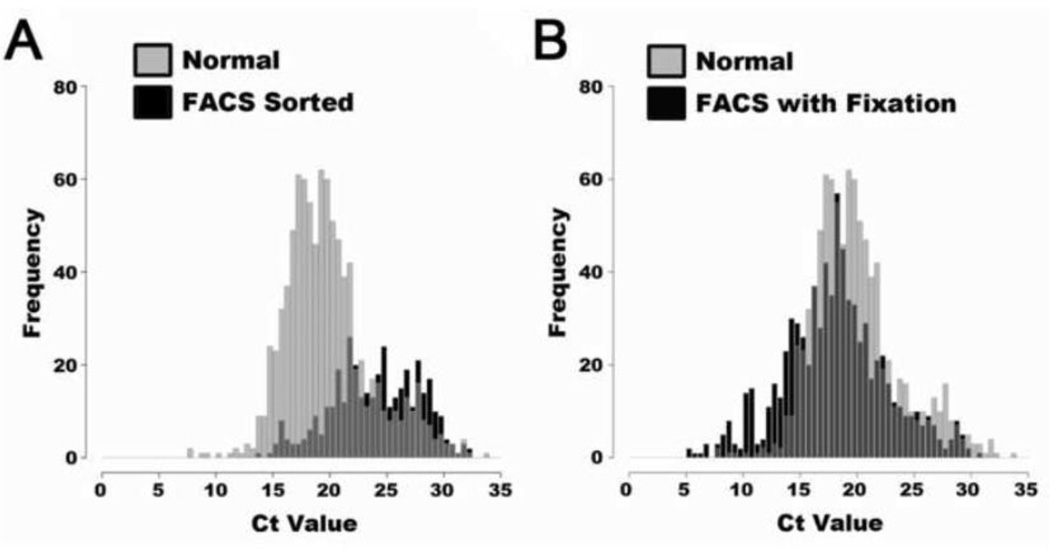
Figure 3. Distribution of Ct values from cells with and without fixation prior to FACS sorting.
The qPCR assay signal after FACS sorting was tested against unsorted and unfixed cells (A) Distribution of unfixed cells that were either selected randomly prior to sorting, or FACS sorted then selected. The FACS sorted cells are compromised in the signal quality resulting in a blunted peak shifted to the right. (B) Display of Ct distribution with fixation procedure prior to FACS sorting which preserves the signal retrieved from the individual cells, and prevents much of the mRNA degradation caused by FACS sorting.

