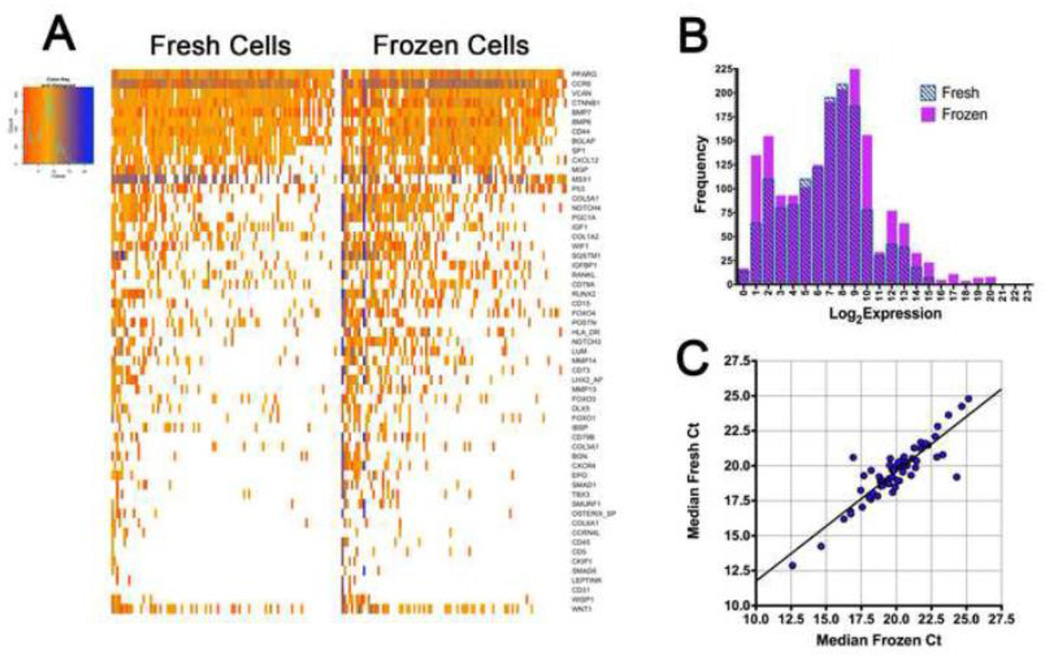
Figure 4. Quality control of gene expression from frozen bone samples.
Using a nanofluidic high-throughput qPCR approach, we performed gene expression on bone tissue which had been frozen for 48 hours at −80°C in a preservative solution. Each column represents a single cell, and each row a gene. (A) Heatmap of single cells from frozen tissue shows a comparable expression to that of the fresh material. This indicates that with proper preparation gene expression analysis is possible on single cells isolated from frozen bone tissue. (B) Histogram of Log2 expression values from fresh and frozen cells generated from the R single cell analysis package. The two populations are approximately equal in signal intensity. (C) Median Ct for each qPCR assay from the fresh cells and the frozen cells. The observed Ct values for each assay are highly correlated (R2=0.780).

