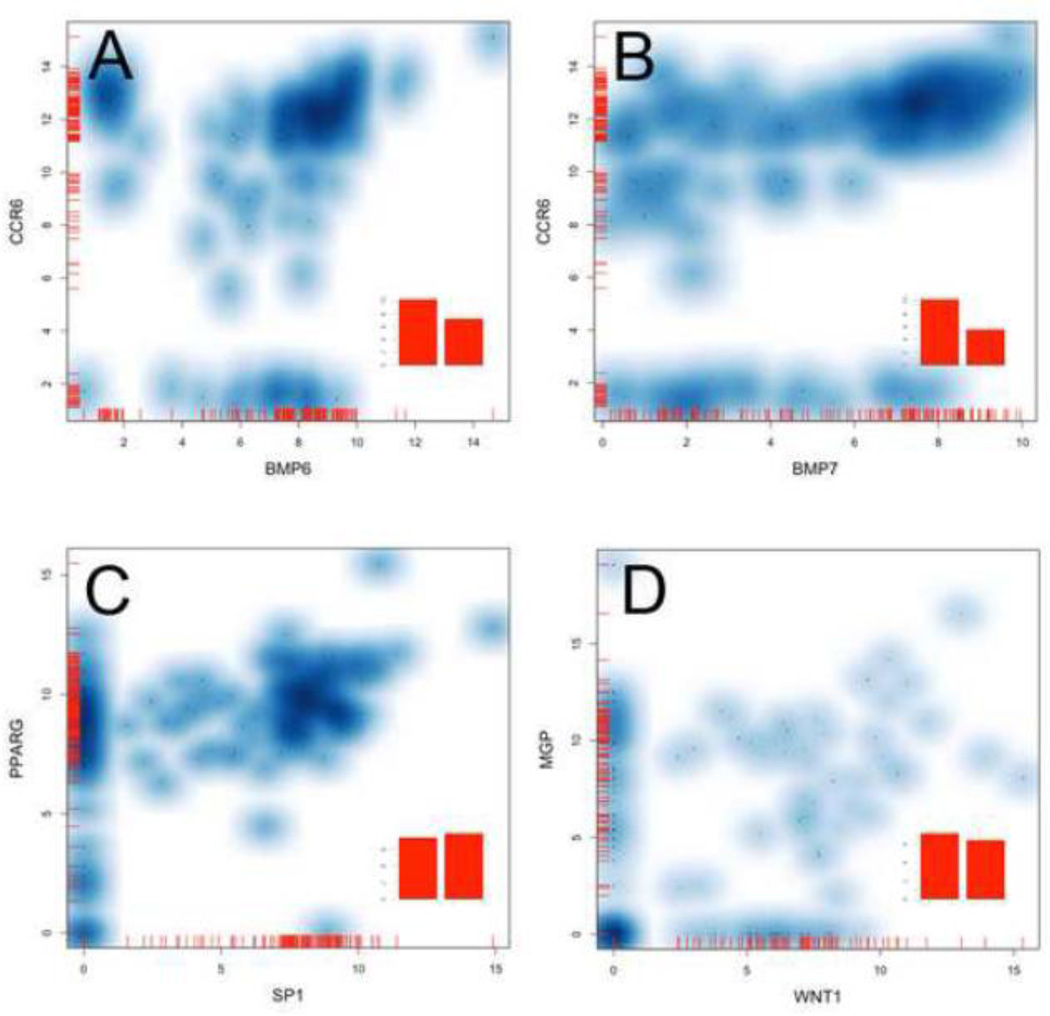
Figure 5. Smoothed scatter plots of single cell expression data.
To examine the distribution of expression profiles that could be observed in the osteoblast lineage cell population, we plotted log2 expression values from 190 cells for specific genes. These plots display the expression of two genes within single cells as a cloud where the darker the blue color the more dense the grouping of single cell expression values. The mean expression across all cells are plotted as bar graphs (inset) which simulates the expression patterning from a bulk mRNA preparation. This data visualization displays the complex expression patterns can be seen. Ccr6 and Bmp6 are expressed in three distinct groupings where cells co-express these genes or express only on of these genes alone (A). This patterning is not observed with Bmp7 which has a more scattered expression profile rather than a discrete grouping (B). The single cell data can be used to identify genes which may have biologically relevant interaction such as PPAR-gamma and transcription factor Sp1 (C), or have very little co-expression like Mgp and Wnt1(D). This visualization has utility for defining subsets of single cells based upon the expression patterns of particular genes of interest.

