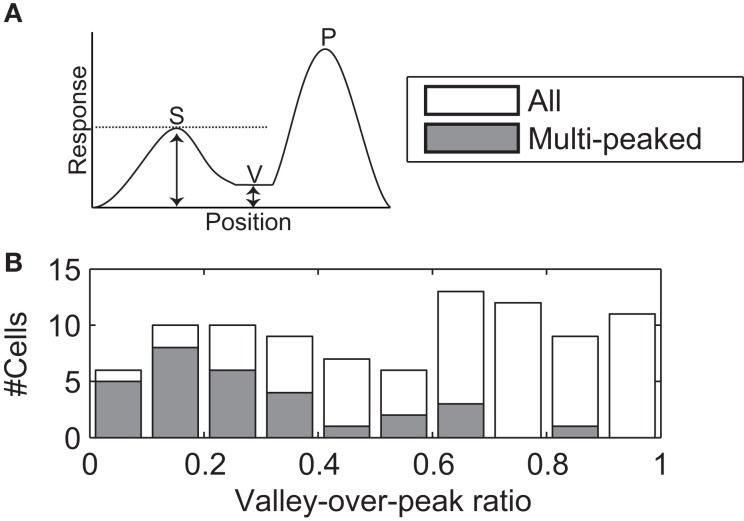
Figure 10.
Valley-over-peak analysis. (A) Schematic of the analysis. P indicates the primary peak (highest sensitivity in the RF), S the secondary peak and V (Valley) is the lowest sensitivity on the line between P and S. The valley-over-peak ratio is defined as the ratio of the tuning strength at V and the tuning strength at S. (B) Histogram of the valley-over-peak ratio for 93 cells. The shaded bars represent the cells that were significantly multi-peaked (i.e., non-monotonic). This analysis shows that, for multi-peaked cells, sensitivity between two high sensitivity peaks on average drops to ∼20% of the response at the weaker of the two peaks.

