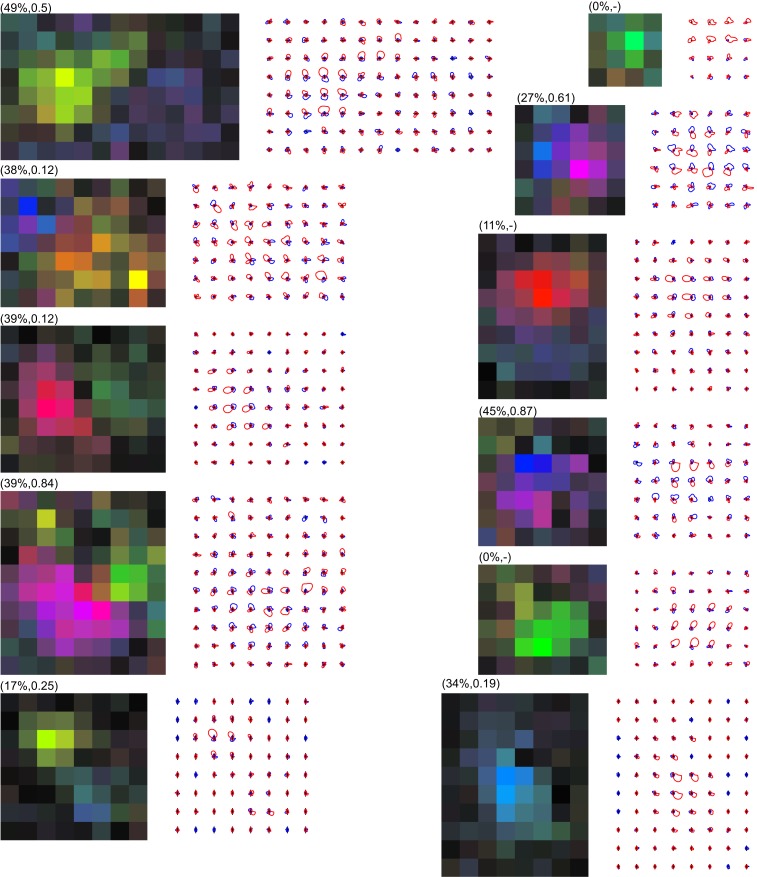
Figure 5.
Examples of MT neurons with multiple preferred directions. The RF maps were calculated at a 1° × 1° spatial resolution and cropped to leave a single pixel outside the bounding box of the RF. The color maps use the representation of Figures 1E,F. The matching line drawings show separate tuning curves for excitatory (red) and suppressive (blue) effects, following the representation of Figure 1D. The labels above the color maps show the percent missing and the valley-over-peak ratio for that specific neuron (See Materials and Methods, and the “Multiple Peaks” section for an explanation of these measures). These examples show that there is a wide range of preferred direction distributions, as well as a wide range of excitatory and suppressive interactions within the RF of MT neurons. In our sample, 38% of neurons had two or more preferred directions within their excitatory RF.

