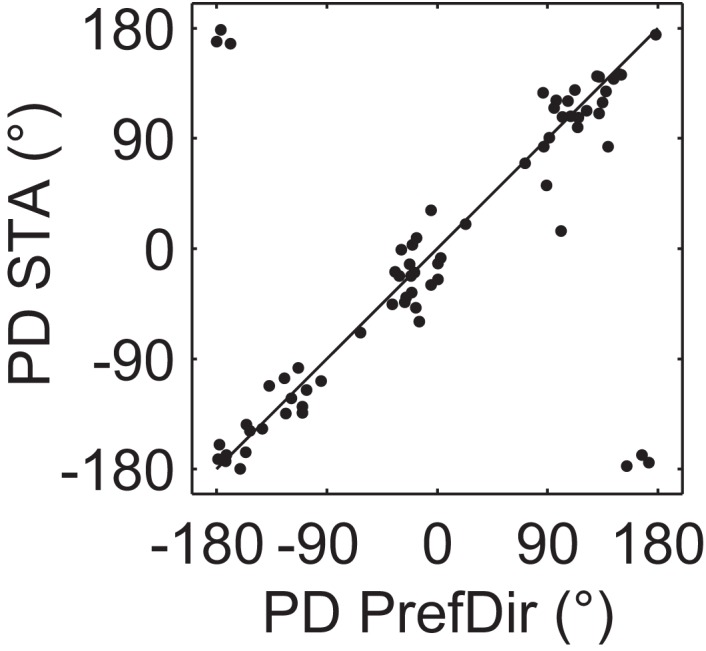
Figure 7.

Validation of preferred direction estimates. Each point represents the preferred direction in one location for those neurons where the PD was mapped using a single moving dot (PrefDir; horizontal axis) as well as the full-field motion stimulus (BMDots; vertical axis). Data are from 70 patches recorded in 22 neurons. Note that the 6 “outliers” are merely the result of presenting polar data on a Cartesian plot. The circular correlation between the two estimates was 0.9 (p < 0.001). This figure shows that the whole-field BMDots motion stimulus and its reverse correlation analysis result in preferred direction estimates that match those obtained with a classical single dot mapping stimulus.
