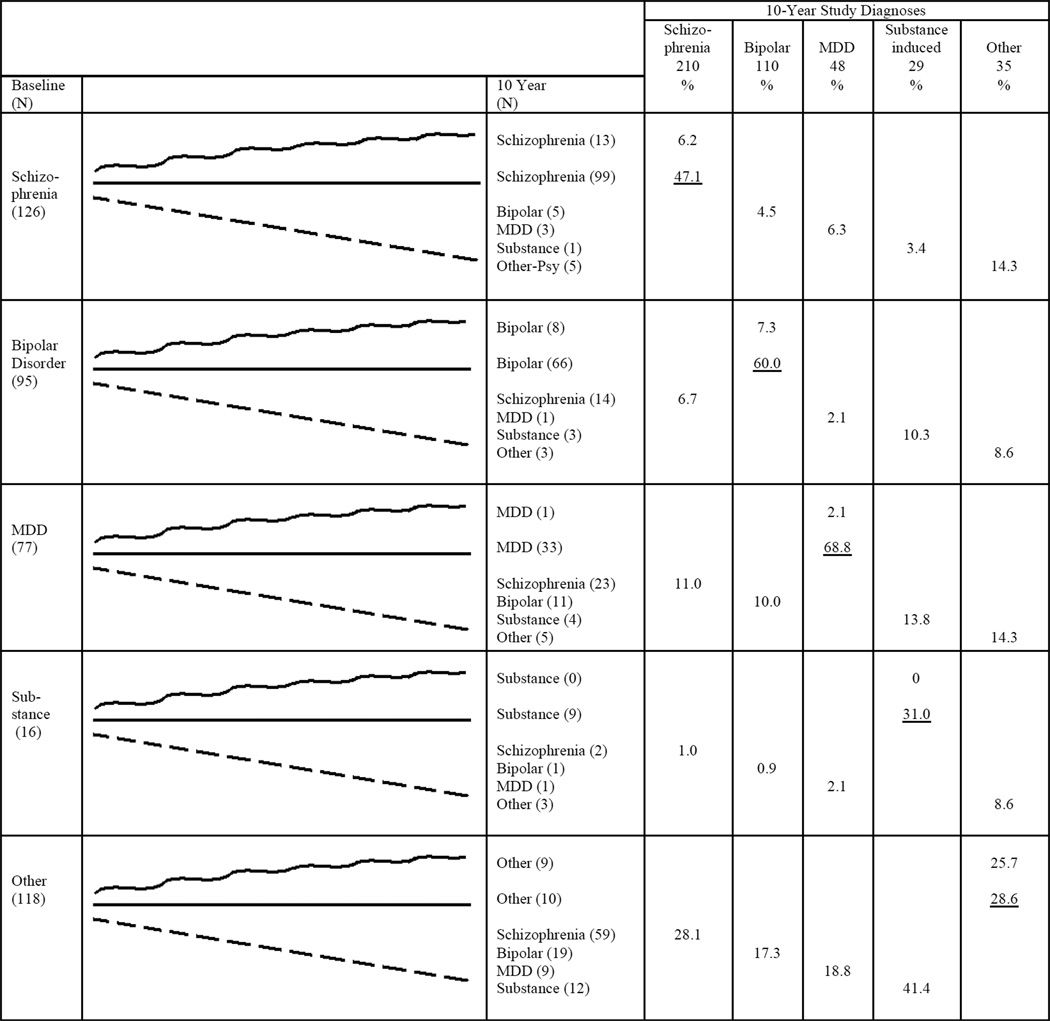
Figure 2. Pattern of Shifts for 432 Study Participants Diagnosed at All 4 Assessment Pointsa.
aStraight line: same diagnosis at baseline (BL), 6-months, year 2, and year 10. Squiggly line: same diagnosis at BL and year 10, but different diagnosis at 6 months or year 2. Broken line: final study diagnosis different from baseline.

