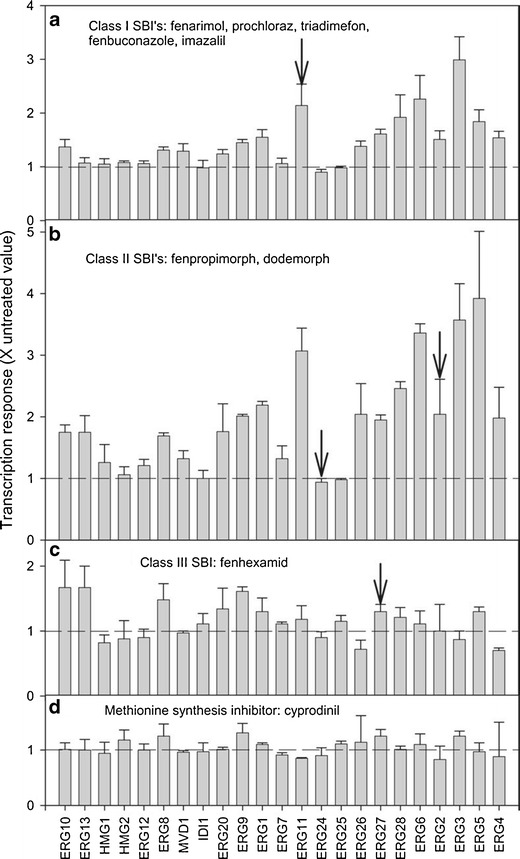
Fig. 2.

Effects of Class I (a), II (b), and III (c) sterol biosynthesis inhibitors, and a putative methionine biosynthesis inhibitor (cyprodinil, d) on expression levels of genes in the ergosterol pathway. Standard errors are shown in a and b, and standard deviations are shown in c and d. Genes are listed on the x-axis from left to right in the order in which they appear in the pathway. The transcription relative to untreated controls is shown on the y-axis. Dashed horizontal lines on the graphs indicate the level of expression at which no change is seen relative to the control. Arrows indicate gene(s) encoding enzymes targeted by each inhibitor class. Reproduced from Kagan et al. (2005)
