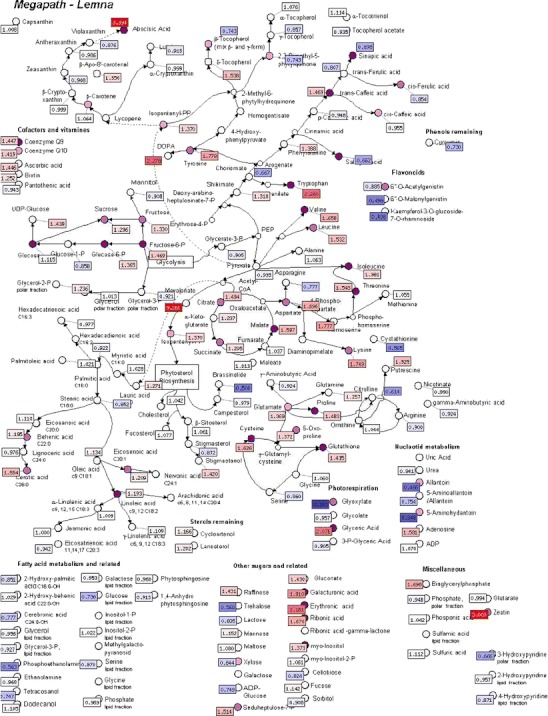
Fig. 4.

Metabolite profile of Lemna paucicostata treated with 6β-angeloyloxy-10β-hydroxyfurnoermophilane from Ligularia macrophylla. Red flags indicate increases in levels, blue flags indicate decreases in levels. Numerical ratios (treated/untreated) are given within the flags. Nodes of metabolites indicate significance of changes at P < 0.01 (dark), 0.01 < P < 0.05 (middle), or 0.05 < P < 0.1 (light) levels. We thank Klaus Grossmann of BASF SE, Limburgerhof, Germany, Charles Cantrell, of USDA, ARS, Oxford, MS, USA, and Nicole Christiansen of Metanomics, Berlin, Germany for these previously unpublished data
