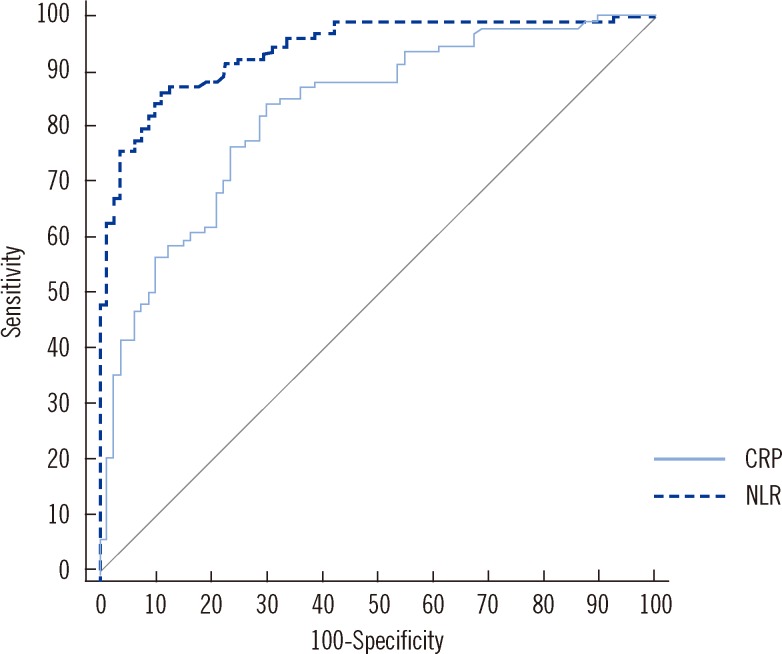
Fig. 2.
ROC curves of C-reactive protein (CRP) and neutrophil-lymphocyte count ratio (NLR) for discriminating tuberculosis from bacterial community-acquired pneumonia. The area under the curve for NLR (AUC, 0.93; 95% confidence interval [CI], 0.88-0.96) was significantly greater than that for CRP (AUC, 0.83; 95% CI, 0.76-0.88) (P=0.0015).

