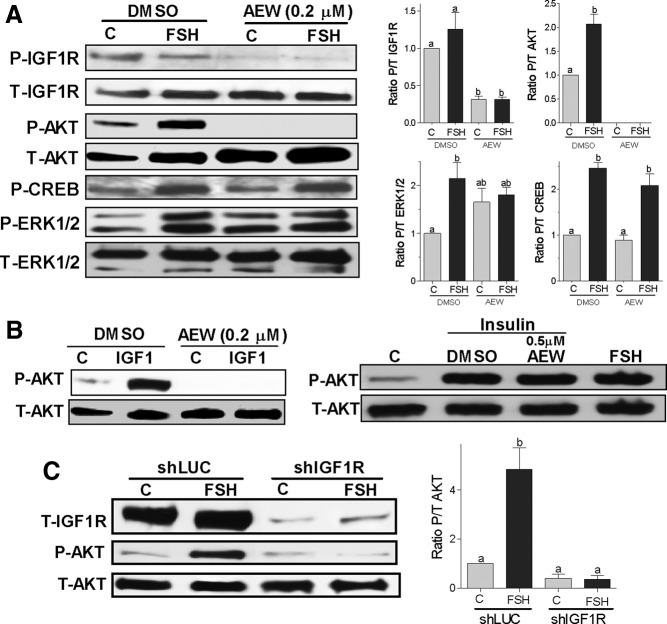
Figure 7.
IGF-IR expression and activity are obligatory for FSH activation of AKT. Panel A, Rat GCs were pretreated with vehicle (DMSO) or with AEW (0.2μM) for 1 hour followed by treatment with FSH (50 ng/ml) or buffer (control [C]) for 1 hour. Protein extracts were subjected to Western blot for phosphorylated (P-) IGF-IR, AKT, ERK1/2, and CREB. Total (T-) IGF-IR, AKT, and ERK were used as a loading control. The graphs show the ratio of phosphorylated to total (P/T) for each band as the mean ± SEM of the densitometry quantification of three separated experiments. Panel B, GCs were pretreated with vehicle (DMSO) or AEW (0.2μM or 0.5μM) for 30 minutes before the addition of IGF-I (20 ng/mL) or insulin (20 ng/mL). Controls (C) were treated with buffer. Total and phospho-AKT were determined 1 hour later. This experiment was performed three times with identical results. Panel C, GCs were infected with a lentivirus carrying a control shRNA (shLUC) or anti–IGF-IR shRNAs (shIGF-IR). At 24 hours after infection, cells were treated with FSH (50 ng/ml) for 1 hour and total IGF-IR and phosphorylated and total AKT levels were measured by Western blot. On the right, the ratio of phosphorylated to total AKT is shown as the mean ± SEM of three different experiments. Columns with different letters differ significantly (ab P < .05; a P < .01).

