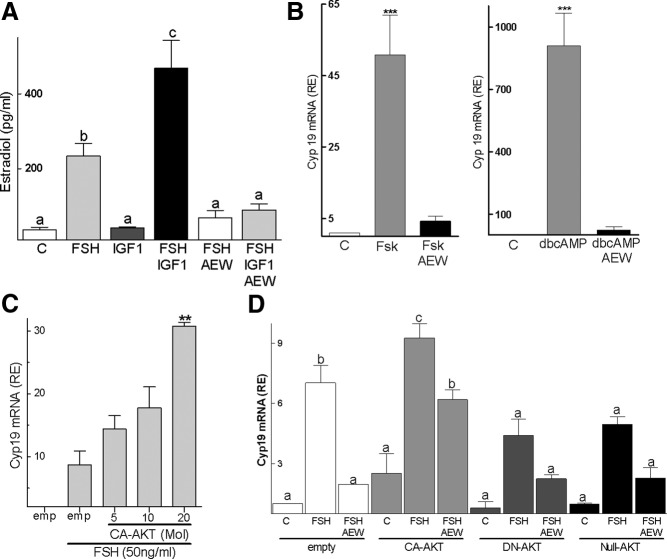
Figure 8.
CA-AKT overcomes the inhibitory effect of AEW. Panel A, Cells were left untreated or treated with FSH (50 ng/ml) and/or IGF-I (50 ng/ml) for 48 hours. Androstenedione was added to the medium at a final concentration of 50nM for the last 4 hours of culture. The concentration of estradiol in the medium was measured by ELISA. Panel B, Rat GCs were pretreated with AEW (0.5μM) for 1 hour before the addition of forskolin (Fsk, 5μM) or dbcAMP (2mM), and 48 hours later, Cyp19 mRNA levels were determined. *** P < .001 vs control (C) and AEW (n = 4). Panel C, Rat GCs were infected with an empty virus (emp) or with a virus that expresses CA-AKT at an increasing multiplicity of infection, and 24 hours later, vehicle or FSH was added to the medium. Cyp19 expression was quantified 48 hours after the initiation of FSH treatment. ** P < .01 vs empty (n = 3). Panel D, Rat GCs were infected with lentiviruses expressing CA-AKT, DN-AKT, or null-AKT. Vehicle (control [C]), FSH, and/or AEW were added to the medium 24 hours later. Cyp19 expression was quantified 48 hours after the initiation of FSH treatment. Columns represent the mean ± SEM (n = 4). Columns with different letters differ significantly (a-b and b-c, P < .05). RE, relative expression.

