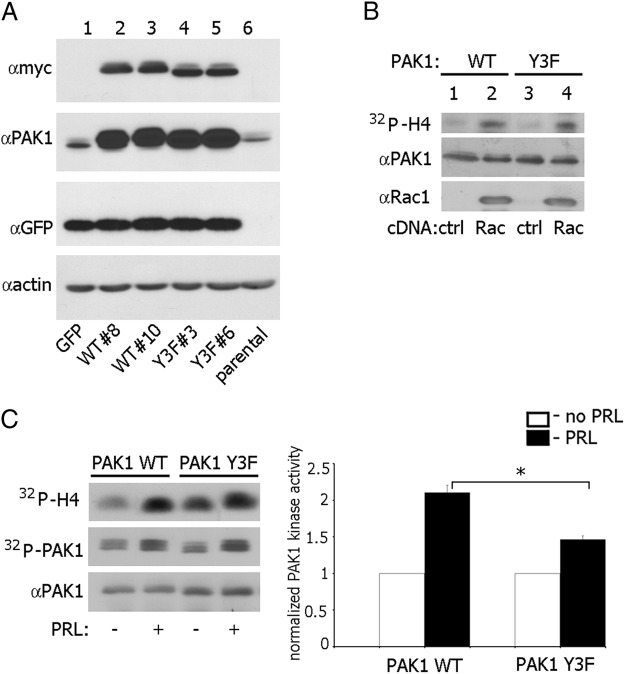
Figure 1.
Characterization of T47D cell lines stably expressing GFP alone, or GFP with myc-tagged PAK1 WT and PAK1 Y3F. A, T47D cells stably expressing GFP (lane 1), two clones stably expressing myc-PAK1 WT (lanes 2 and 3), two clones stably expressing myc-PAK1 Y3F (lanes 4 and 5), and parental T47D cells (lane 6) were lysed, and proteins were resolved by SDS-PAGE. Overexpressed proteins were visualized by immunoblotting with antimyc Ab (upper panel). The same membrane was stripped and reblotted with anti-PAK1 Ab to visualize endogenous (lanes 1 and 6) and overexpressed PAK1 (lanes 2–5) (middle panel). B, myc-PAK1 was IP'd with antimyc Ab from T47D PAK1 WT (lanes 1–2) or T47D PAK1 Y3F cells (lanes 3–4) transfected with vector (lanes 1 and 3) or constitutive active Rac1 V12 (lanes 2 and 4). IP'd myc-PAK1 was subjected to an in vitro kinase assay with H4 histone as a substrate (32P incorporation into H4 histone indicated in upper panel), and probed with anti-PAK1 (middle panel) and anti-Rac1 (lower panel) Ab. All blots are representative of at least three experiments. C, T47D PAK1 WT and T47D PAK1 Y3F cells were treated with or without PRL. Myc-PAK1 was IP'd with antimyc Ab and subjected to the in vitro kinase assay as described in panel B. 32P incorporation into PAK1 molecule (PAK1 autophosphorylation) is indicated in the middle panel. Relative PAK1 kinase activity was then normalized by the amount of IP'd PAK1 for each lane and plotted (right plot). Bars represent mean ± SE * P < 0 .05. n = 3. ctrl, Control.

