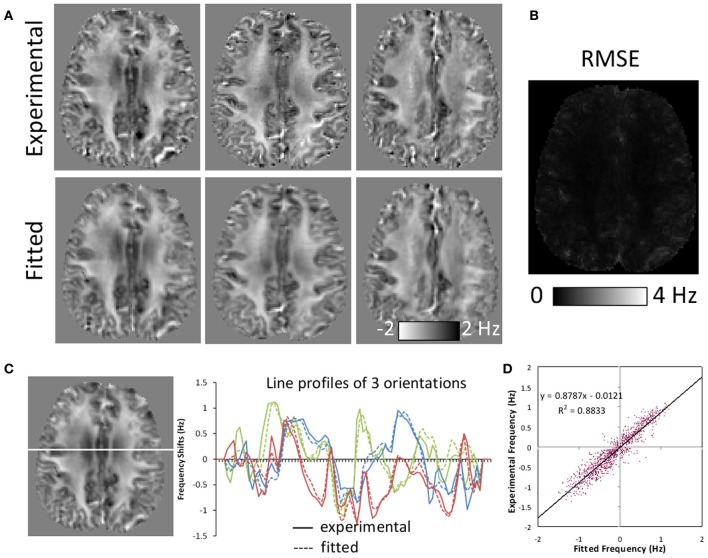
Figure 4.
Comparison of frequency maps measured experimentally and those fitted with susceptibility tensors. (A) Comparison of representative experimental and fitted frequency maps along three orientations. Fitted maps were slightly smoothed but showing similar contrast. (B) A representative root-mean-squared-error (RMSE) map between the experimental and fitted frequency along one orientation. Significant errors were only observed around tissue boundaries. (C) Line profiles of experimental and fitted frequency maps for the same three orientations as in (A). (D) Experimental and fitted frequency values along the line shown in (C) demonstrating high correlation.

