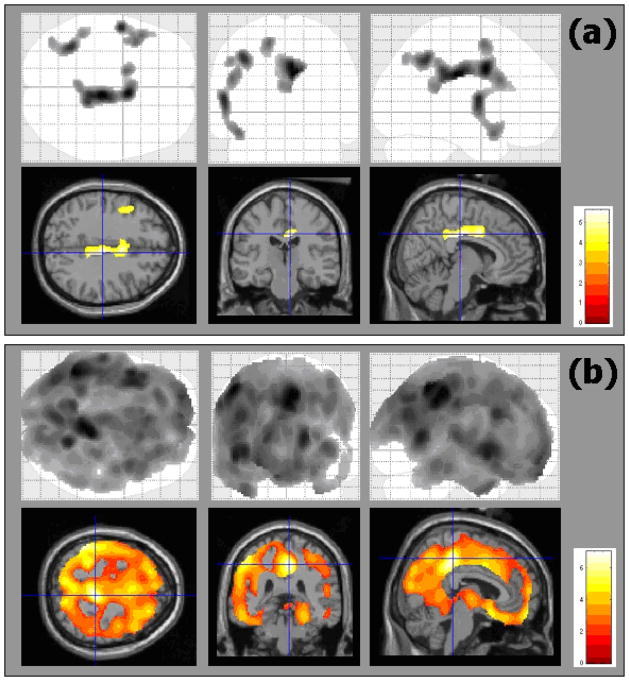
Figure 2.
Regional changes in brain perfusion between baseline and 2-year follow-up in MCI (a) and AD (b) groups.
The top row is the SPM5 “glass image” showing all significant voxels in axial, coronal and saggital views, respectively. The bottom row shows the significant voxels projected onto the MNI template, focusing on peak values in the cingulate gyrus.

