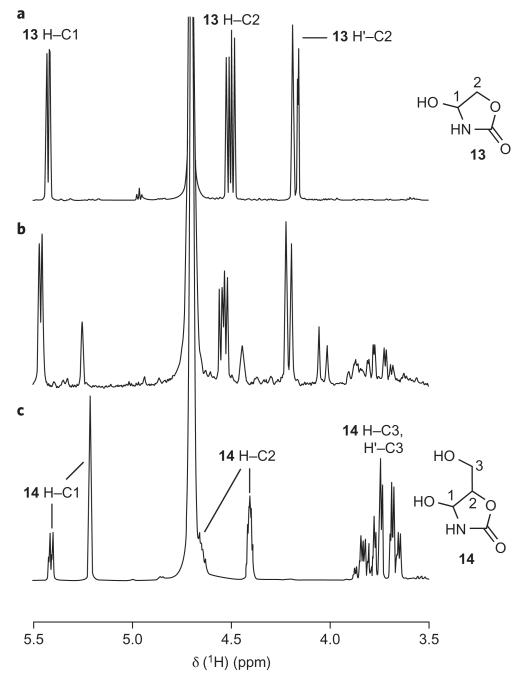
Figure 4. 1H-NMR analysis of photochemical products.
a–c, 1H-NMR spectrum of the products after an 8 h reaction without intermediary sampling (b) as compared to the 1H-NMR spectra of 13 (a) and 14 (c). Small chemical shift differences are thought to be due to pH differences, and are not seen in spiked spectra (see Supplementary Information).

