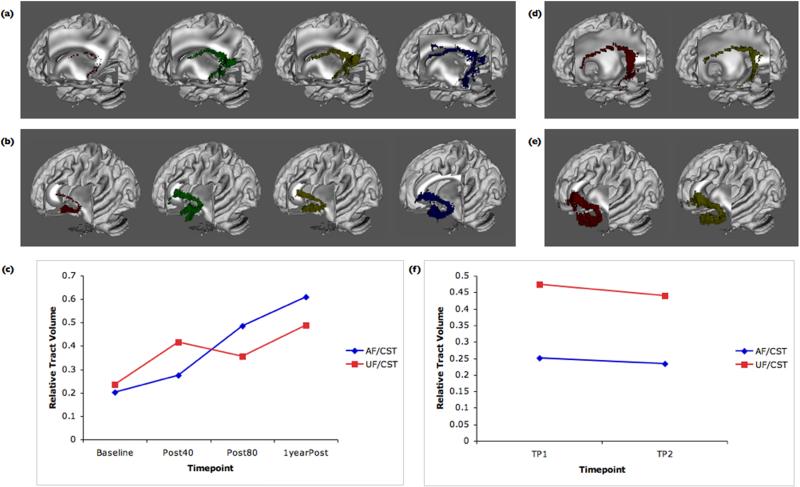
Figure 4.
Changes in the AF and UF after treatment with MIT. LF's AF (a) and UF (b) are shown at Baseline, Post40, Post 80, and at one year post-treatment, and (c) volumes for the two tracts are plotted for the same four time points normalized by the corticospinal tract volume of the right hemisphere. For LF's twin sister, the AF (d) and UF (e) are shown at time points 1 and 2, and (f) relative volumes for these tracts are plotted over time. Time points 1 and 2 for LF's twin sister were separated by approximately four months, to match the interval between LF's Baseline and Post80 scans, which is the period during which the maximal structural change occurred.

